How to Build a Custom Report
Build your reporting dashboard using any combination of available metrics, add campaign / client logo imagery to your report intro & customize results further using filters along with the ability to re-name metrics for clarity.
*IMPORTANT*: Please carefully read through updates below and watch the demonstration video further below to understand the latest updates to Custom Reports.
Custom Reports have evolved to offer our Users more customization in the following ways:
i. Ability to add a Cover Image, Client Logo & description as an intro to your report
ii. Ability to choose between a Standard or Dynamic report
a. Standard: Similar to the previous iteration of Custom Reports, Users select their initial Story(s) upon which results will be based, then re-visit Custom Report builder interface at a later date to manually select & add NEW stories and their respective results, as necessary.
b. Dynamic: Creates a report that dynamically adds associated stories based on a Campaign, Advertiser, Property, Project or Client Order.
Example: A User chooses to create a report based on a Campaign as a whole with 2x stories published and 2x additional stories pending to be added to the same Campaign. The saved Dynamic Custom Report will then automatically add the 2x pending stories to the Custom Report once those stories have been added at the Campaign level. User will not be required to re-visit the Custom Report and add the latest stories manually.
iii. Add Filters to your chosen report 'Highlights' and 'Report Components' to limit / isolate the results to specific criteria based on Filters like:
a. Date Range - A specific timeline that falls within the Custom Report's overall Start / End date.
b. Post Filter - Isolate results to individual URLs, Facebook Posts, Google Ads Manager Line Items (etc) which were part of a single story or across several stories associated with the chosen Category i.e.: Campaign, Advertiser, Property, etc.
c. Other Filters - Some examples for Pressboard Analytics and Pressboard Links being 'Location', 'Traffic Source', 'Device Type', 'UTM_Campaign', etc.
Note: Options under 'Other Filters' will vary based on the chosen metrics in either Highlight or Report Component. Some metrics may have limited filters.
Video; How to Build a Custom Report
Custom Report buttons:
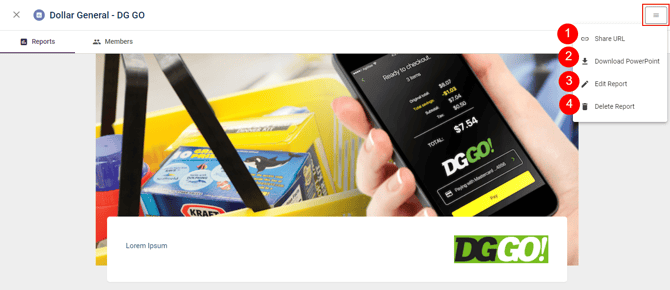
Once you create your Custom Report, you'll be taken to a preview of the report. If you're content with the data presented, you can click on the 'Manage Report' icon in the top right corner to access the following options:
(1) Generate Share URL - Opens in new tab
(2) Generate PowerPoint export - Wait for .PPT to generate, then click to download
(3) Edit Report - If editing an existing report, any new changes that are saved will immediately be updated within the report's corresponding Share URL.
(4) Delete Report - Any recipients of the report's Share URL will no longer be able to access the report's results (Error message: Entity not found.)
