One of the most powerful aspects of the Pressboard Studio platform is reporting. The reporting dashboard provides a summary of how all stories are doing in a campaign, in aggregate as well as by story.
Detailed story reports show an exceptional amount of data to help you better understand your story performance, from reads, to active reading time, to clicks and traffic sources. Pressboard Studio even measures scrolling behavior.
The Pressboard Studio platform also has Moat and Google Analytics integrations for even more data.
There are two areas where reports can be viewed: either by creating a custom report (which also generates an external 'Share URL') to view aggregate results for a campaign, or by viewing reports for an individual story.
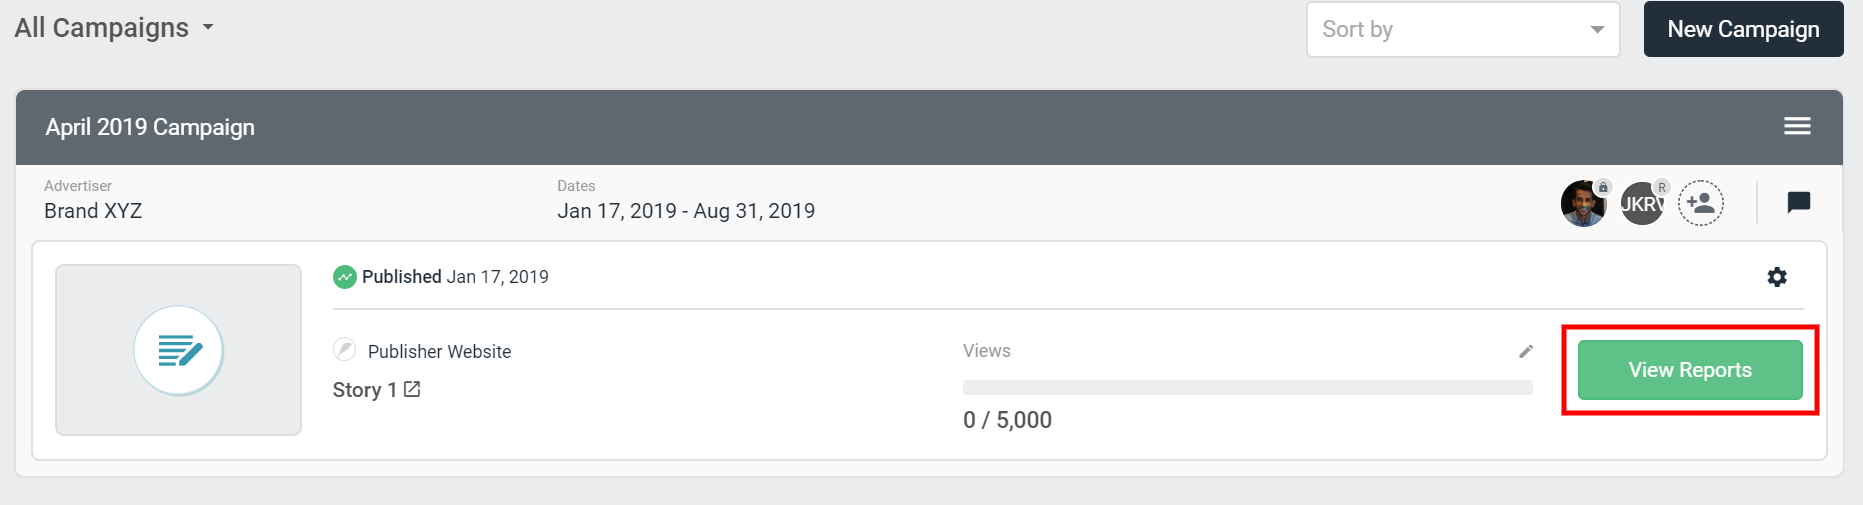
To view reports for a story:
- Click 'View Reports' when looking at the Story under Campaigns
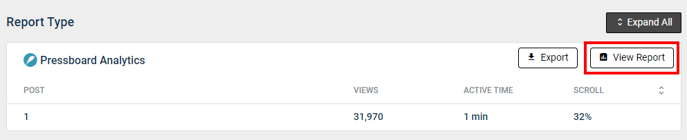
- Scroll to the specific section and click the 'View Report' button in the top right corner
The screenshots and descriptions below explain what each section of Pressboard Analytics means:
- Overview and Realtime Report
- Attention
- Attention Buckets
- Traffic Sources
- Locations
- Viewability
- Devices
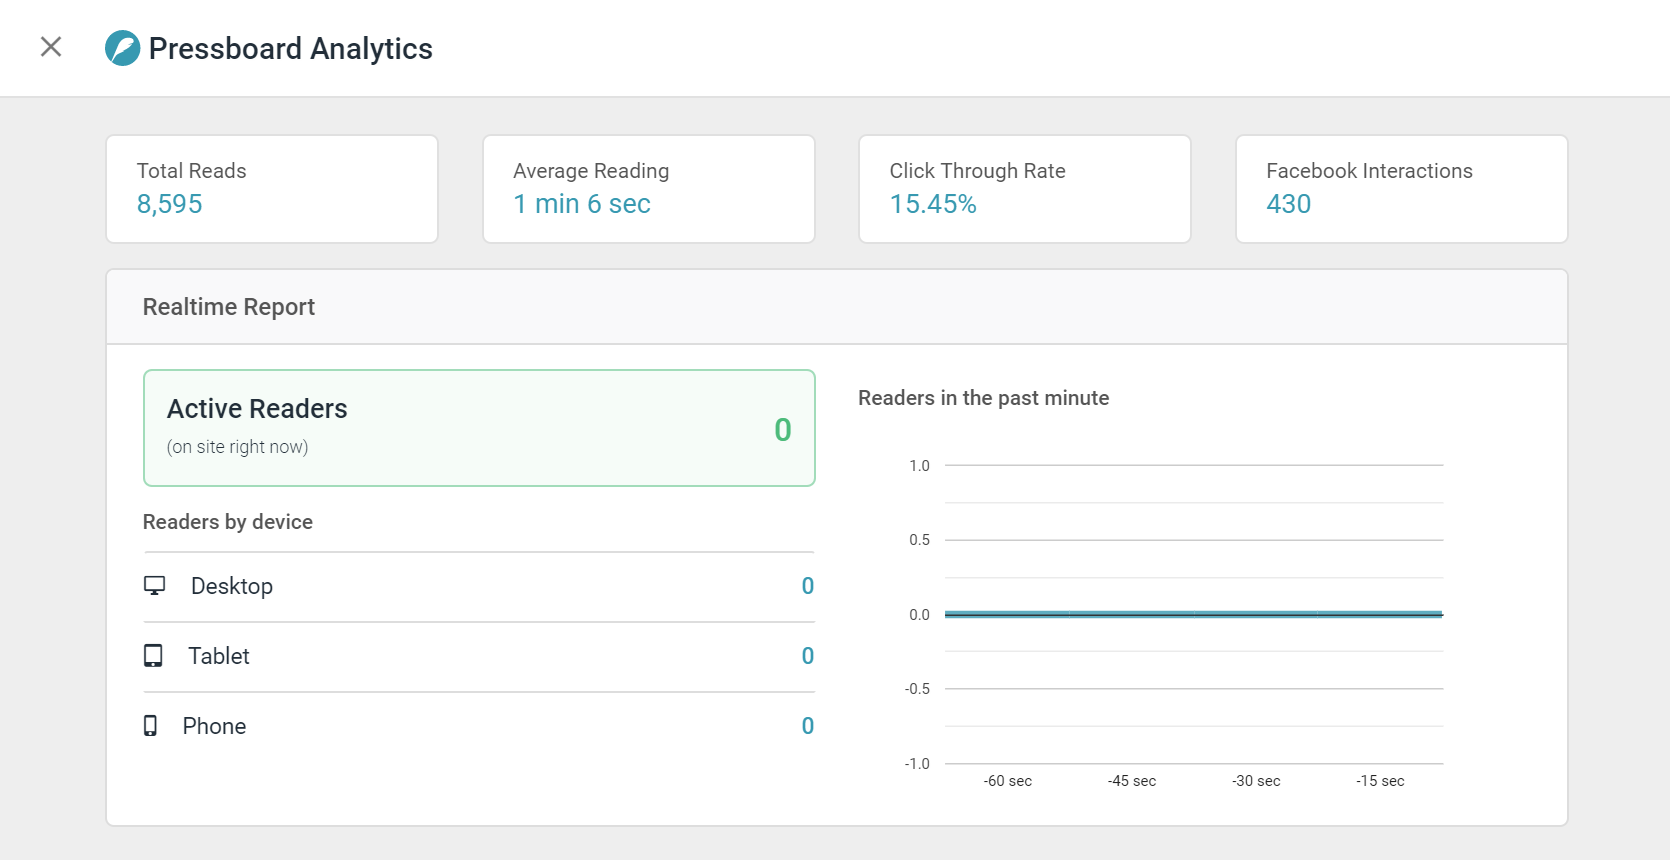
1. Overview and Realtime Report
Quickly view metrics for a story at a glance, including total reads, average reading time, Facebook interactions and click-through rate. Realtime report shows the number of readers on your page at that moment.
2. Attention
How active are your readers? Say goodbye to clicks and impressions. Attention measurement takes content analysis to a whole new level. Our technology analyzes active reading time, from mouse movements, to scrolling behavior, to location on the story page. Find out not only if a story is engaging, but where readers are dropping off.
- Date Range: Visual representation of the number of reads over the set date range. Click the dates filter to change the date range for all report data
- Reads: Number of reads on the story. This is measured based on the number of page views on the web page itself or total number of times the article/page was loaded.
Methodology: A Pressboard ‘Read’ is simply a successful article page-load in the audience’s web browser where Pressboard’s proprietary Javascript also loads successfully. If the reader bounces off the page before Pressboard Javascript can load fully, the reader’s session is not counted as a qualified Read. - Average Active Time: The amount of time actively spent on-page based on an average across all readers. Active reading is calculated by following mouse movements and scrolling behaviour. More specifically, Pressboard Analytics' javascript acts as a 'heartbeat' on the page, looking for the audience's active clicking & scrolling behaviour. When it does observe these active engagement queues, each second is accounted for. This is a vastly different measurement from Google Analytics’ Average Time on Page (or Avg. Page-View Duration) metric, which is sampled and doesn't take into account active versus dormant time on the page and
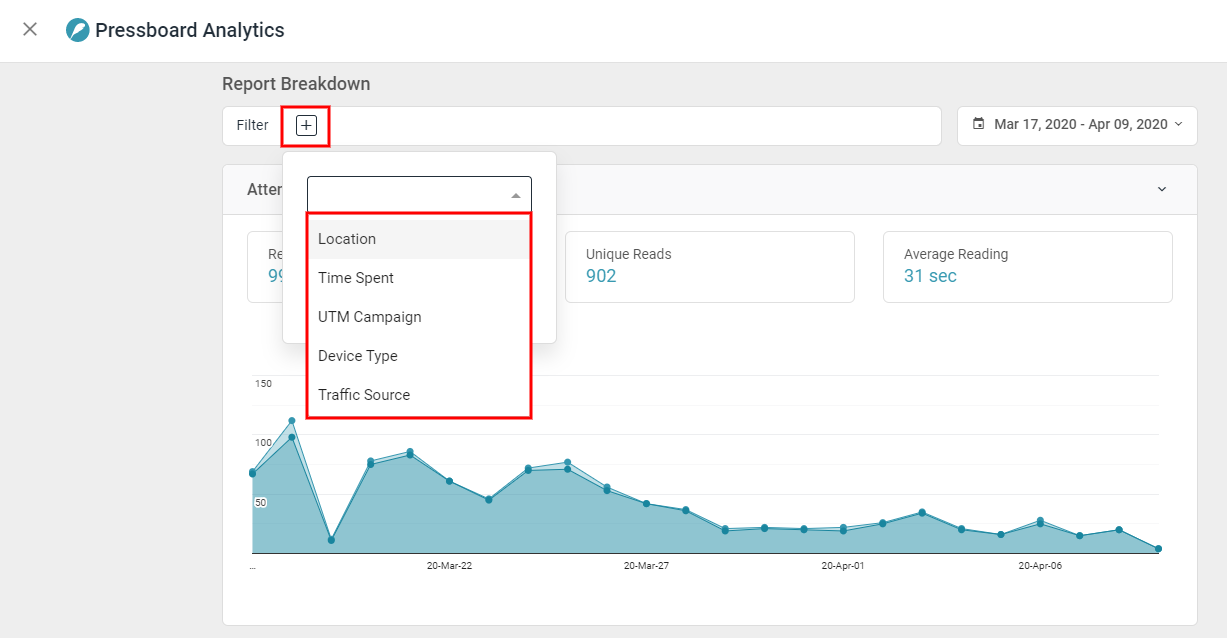
NEW - Report Filters
Just above the Attention module, you will find a list of Filters including Location, Time Spent, UTM Campaign , Traffic Sources and Device Type. In addition, you can combine and layer multiple filters to take a closer look at performance.
Learn more about these new filters here.
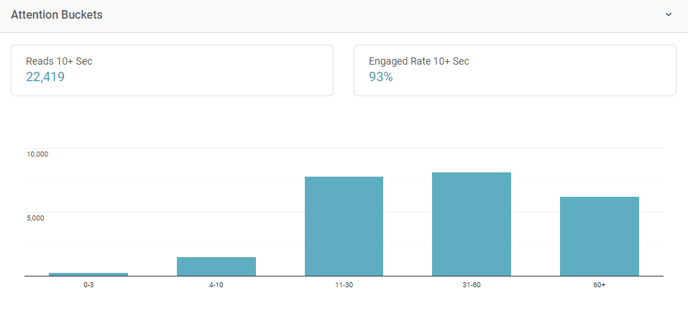
3. Attention Buckets
This report allows you to group reads by the average active reading time to see where the majority of your readers sit in engagement time. There are two static highlights above the graph:
i. Reads 10+ sec
Easily see what volume of Reads were over 10+ seconds based on Pressboard Active Time.
ii. Engaged Rate 10+ sec
Easily see what percentage of your Total Reads were over 10+ seconds, based on Pressboard Active Time.
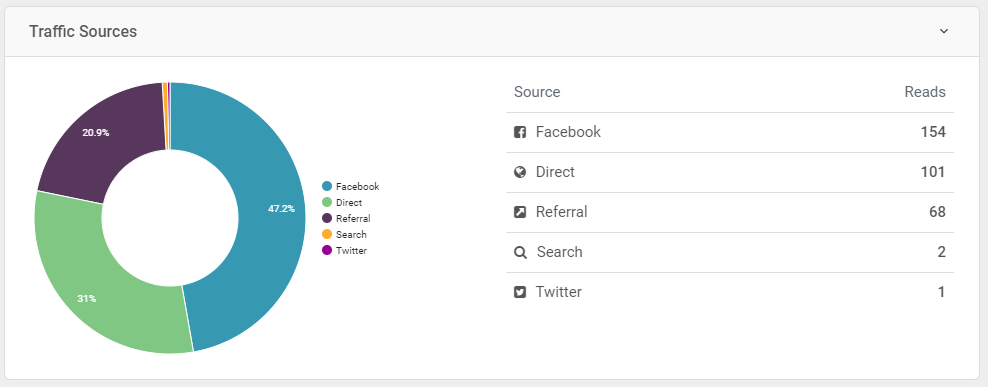
4. Traffic sources
Learn how much of the story readership is coming from social media compared to direct traffic, search traffic or referrals.
Methodology: We use the ‘Referrer’ HTTP header of the incoming request to report on the source of traffic to an article. This is standard practice and part of the open web. We use the Referrer to report on how much of the story’s readership is coming from social media compared to direct traffic, search traffic or referrals. We further break down the social traffic to see how many readers are coming from Facebook versus LinkedIn or other social platforms.
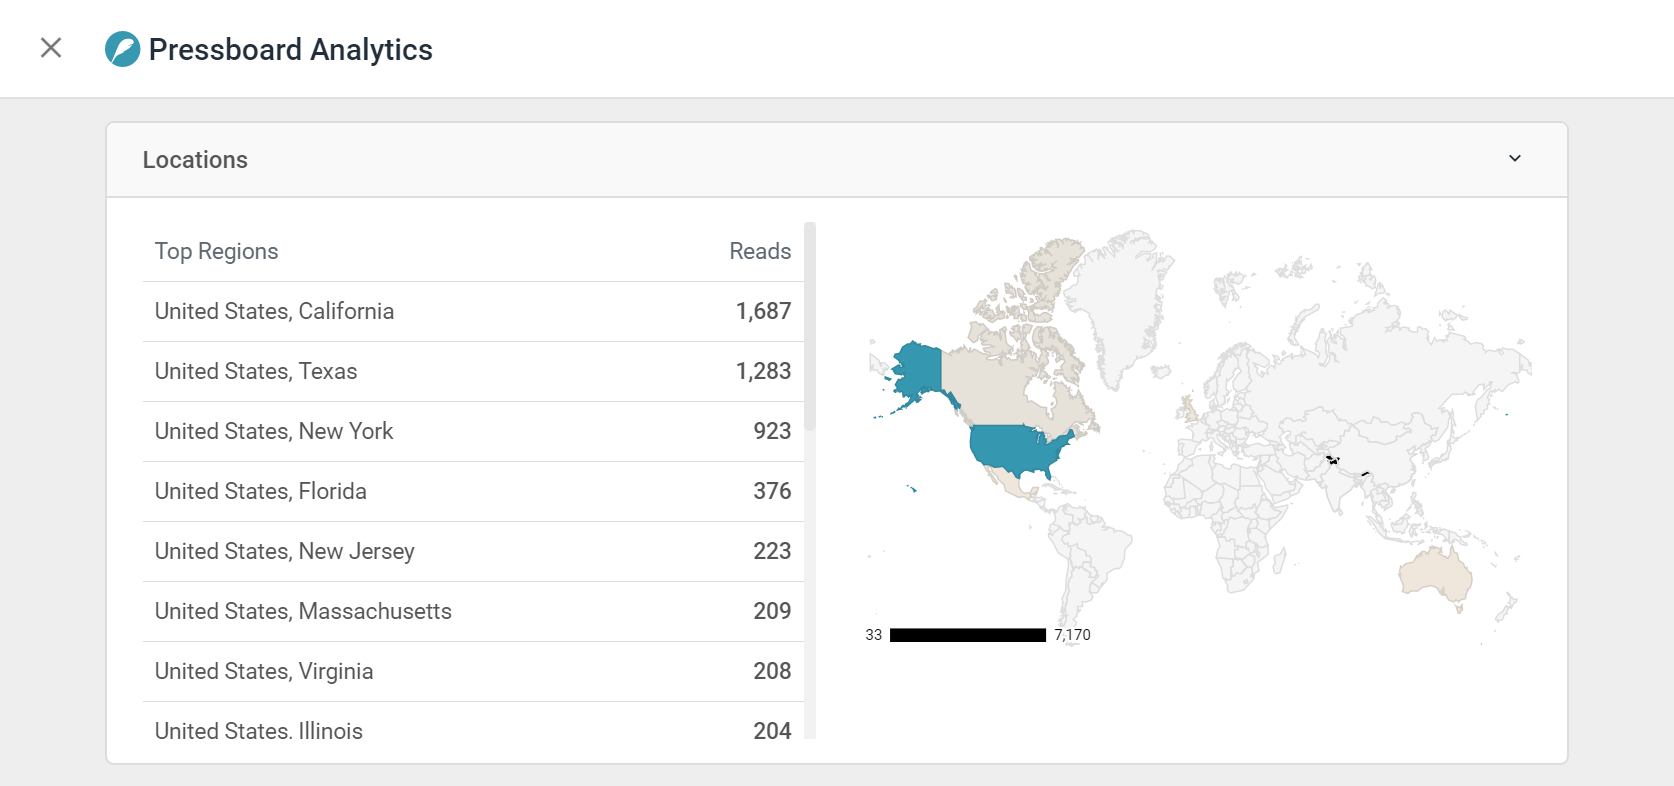
5. Locations
The locations report shows the geographic location of the reads. By clicking on the map, you can drill into and out of various countries. Break down the reads by country or even by province/state.
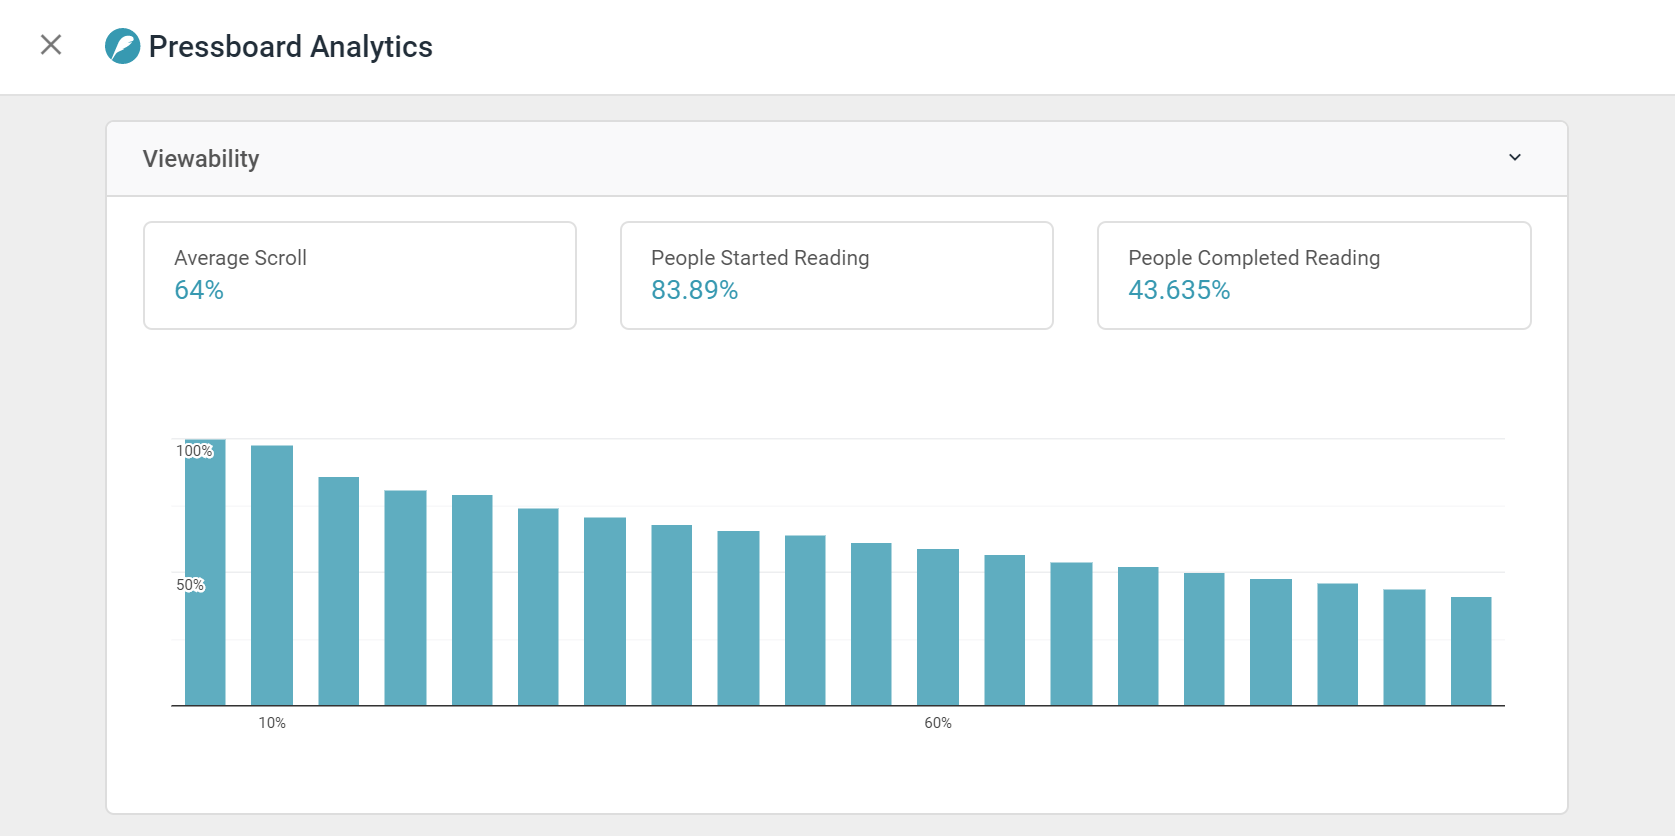
6. Viewability
The viewability report displays statistics related to scrolling behaviour (Scroll Depth %) based on an average across all readers or as a reflection of any filters you have activated. Viewability also shows where readers are dropping off in a story and how many people read the story in its entirety.
Note: Average Scroll % is determined by where the scroll depth tag is placed on-page. For accuracy, it is recommended to be placed right after the last line of article text, however, some choose to place the code at the bottom of the page. Doing this may skew results (lower average) as page visitors seldom scroll all the way down to the bottom of a page.
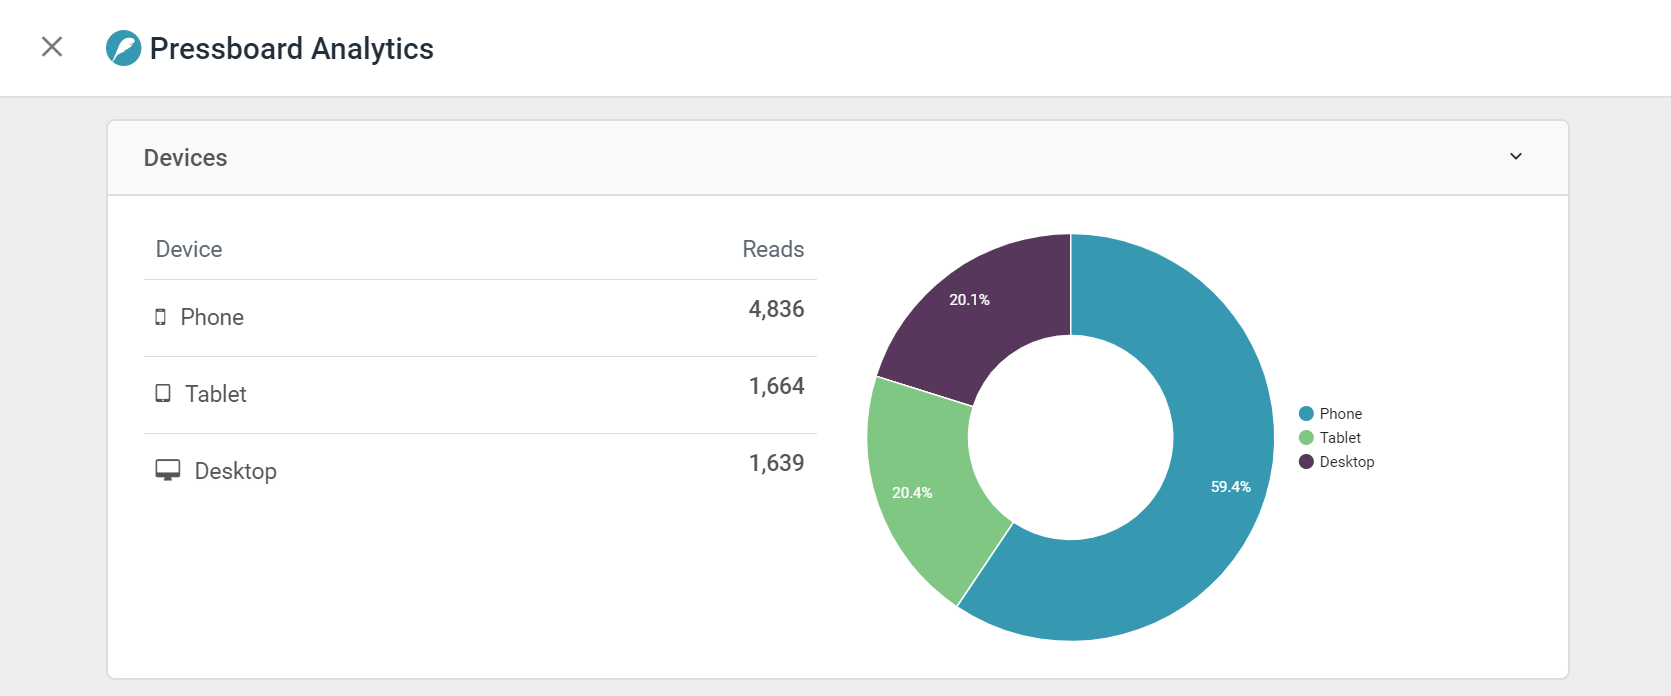
7. Devices
Learn what device readers are seeing your story on, whether it’s mobile, tablet or desktop.
See also: How to Build a Custom Report
Did this answer your question?