Measures and Dimensions:
These are the two basic ingredients of any query. Measures are equal to metric values from any data source i.e Pressboard Average Time. Dimensions determine how selected metrics are broken down i.e 'Story Campaign' Name, 'Story Property' and more.
Other functions:
Optionally, you can select any Dimension to filter and isolate query data. For example, Pressboard Analytics Reads from a specific 'Traffic Source' (Facebook).
See below list of most frequently used Dimensions which can also be applied as Filters to a widget query.
Dimensions
- Report Type (Google Analytics, Facebook Ad Sets etc.)
- Story Property Name
- Story Advertiser Name
- Story Campaign Name
- Story Label Name
- Story Label Value
- Story Publish Date (All Time, Last 30 Days, This Year, Custom)
How to use Label Names & Values
Labels tagged to your Stories can help you add more colour to queries such as "how well did vertical X perform on CTR last year" or "did video content deliver a higher Average Active Time than non-video content?" and more.
Structure your data by what matters to your content business. Refer to this doc for examples and inspiration.
Example
Pressboard Analytics Average Time on Page or Google Analytics Average Page View Duration split by Content Type or Industry.Story Label Name & Value Filter
Story Label Names & Values when added to Widget query will help isolate the results strictly against a subset of Name and/or Value filters.
Example: Story Label Name Filter
# Average Active Time by Industry [Name] = Beauty [Value] but also apply a filter to only include results from Stories where the Content [Name Filter] was 'Client Supplied' [Value Filter] or 'Studio Created' [Value Filter]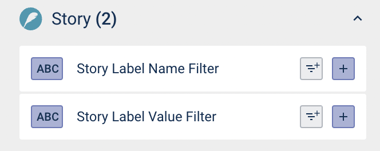
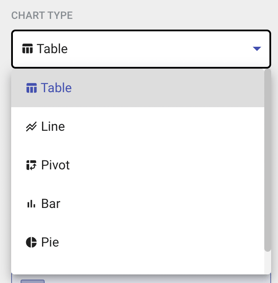
Chart Type
Select the visualisation option that best fits your data.
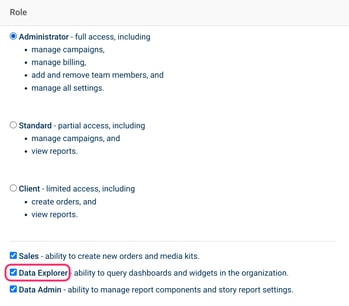
Q: What do I need to access this module?
See Account Settings > Organisation > Members to enable the 'Data Explorer' permission. At minimum users require a 'Standard' or 'Administrator' user role.