🌻 Best Practices
Templates
No need to create the same reports time and time again. Templates offer a way to standardise ways of working and save you time especially if some metrics and components are consistent between reports being created on a frequent basis. Create 1 x Template for each use case.
Customisation
Add flair and colour with a cover image and logo. Include text in the description box with any important campaign information or highlights to call out. The character limit is set to 3,000.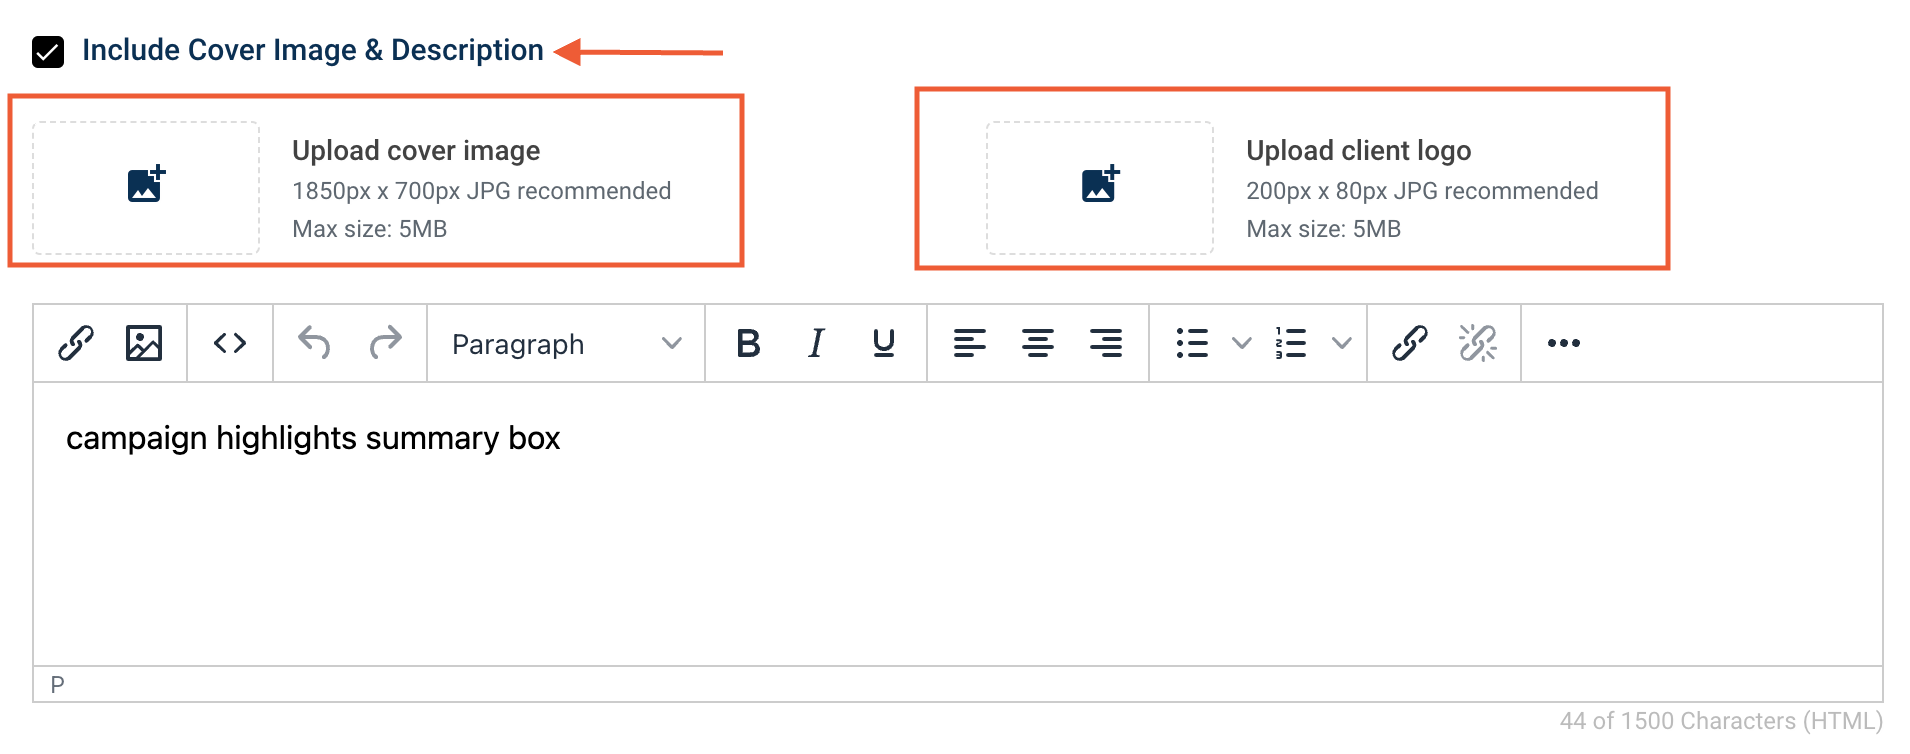
Generate a 'Share URL'
Circulate a public link to the the complete Custom Report with anyone externally.

Duplicate a Custom Report
Simplifies workflows, in addition to using Templates.

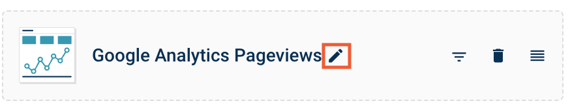
Re-name components for clarity
Update the name of components in line with naming conventions for consistency.
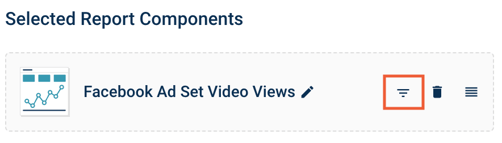
Apply Filters
Isolate the results of a component to specific criteria based on Date Range, Post and anything pertaining to the data source, ie. Line Item, UTM, Creative Name etc.
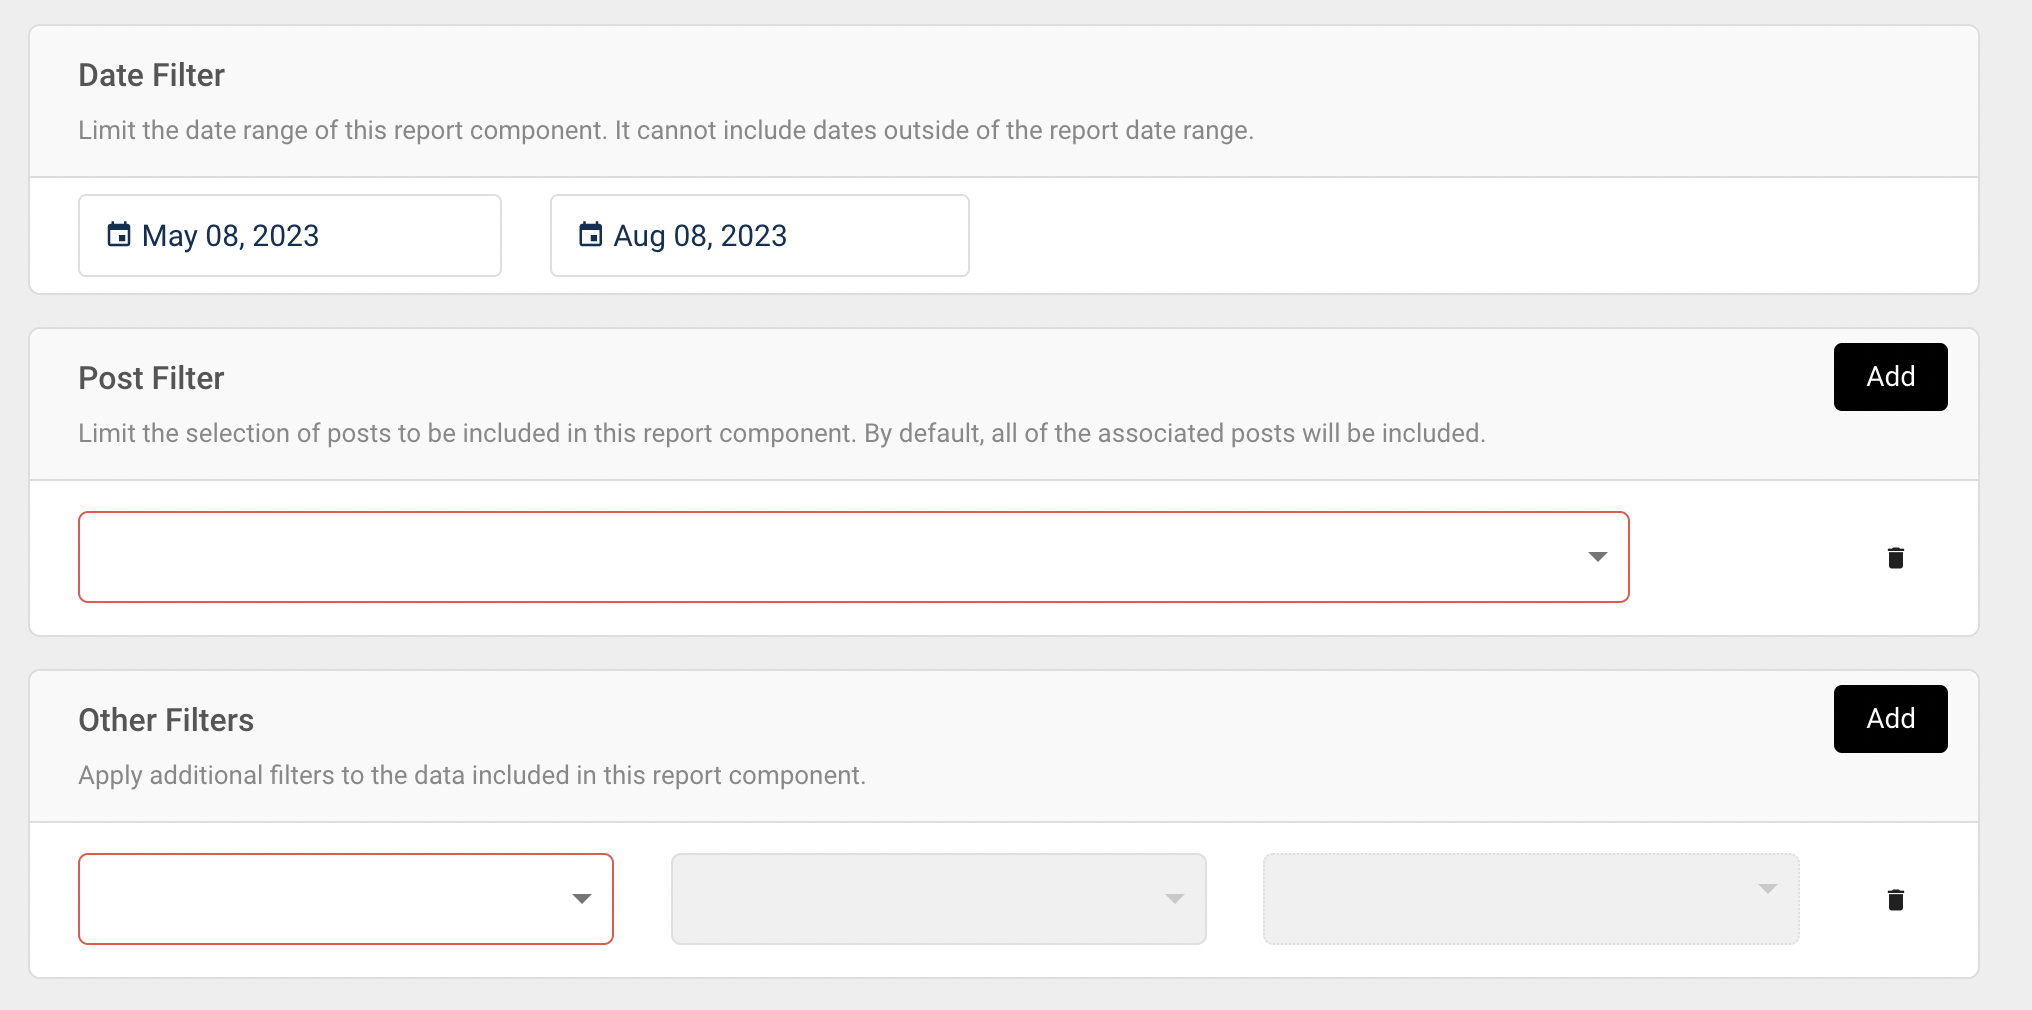
📍 frequently used filters and titles applied to components can be added directly to your Template.
📊 Report Components
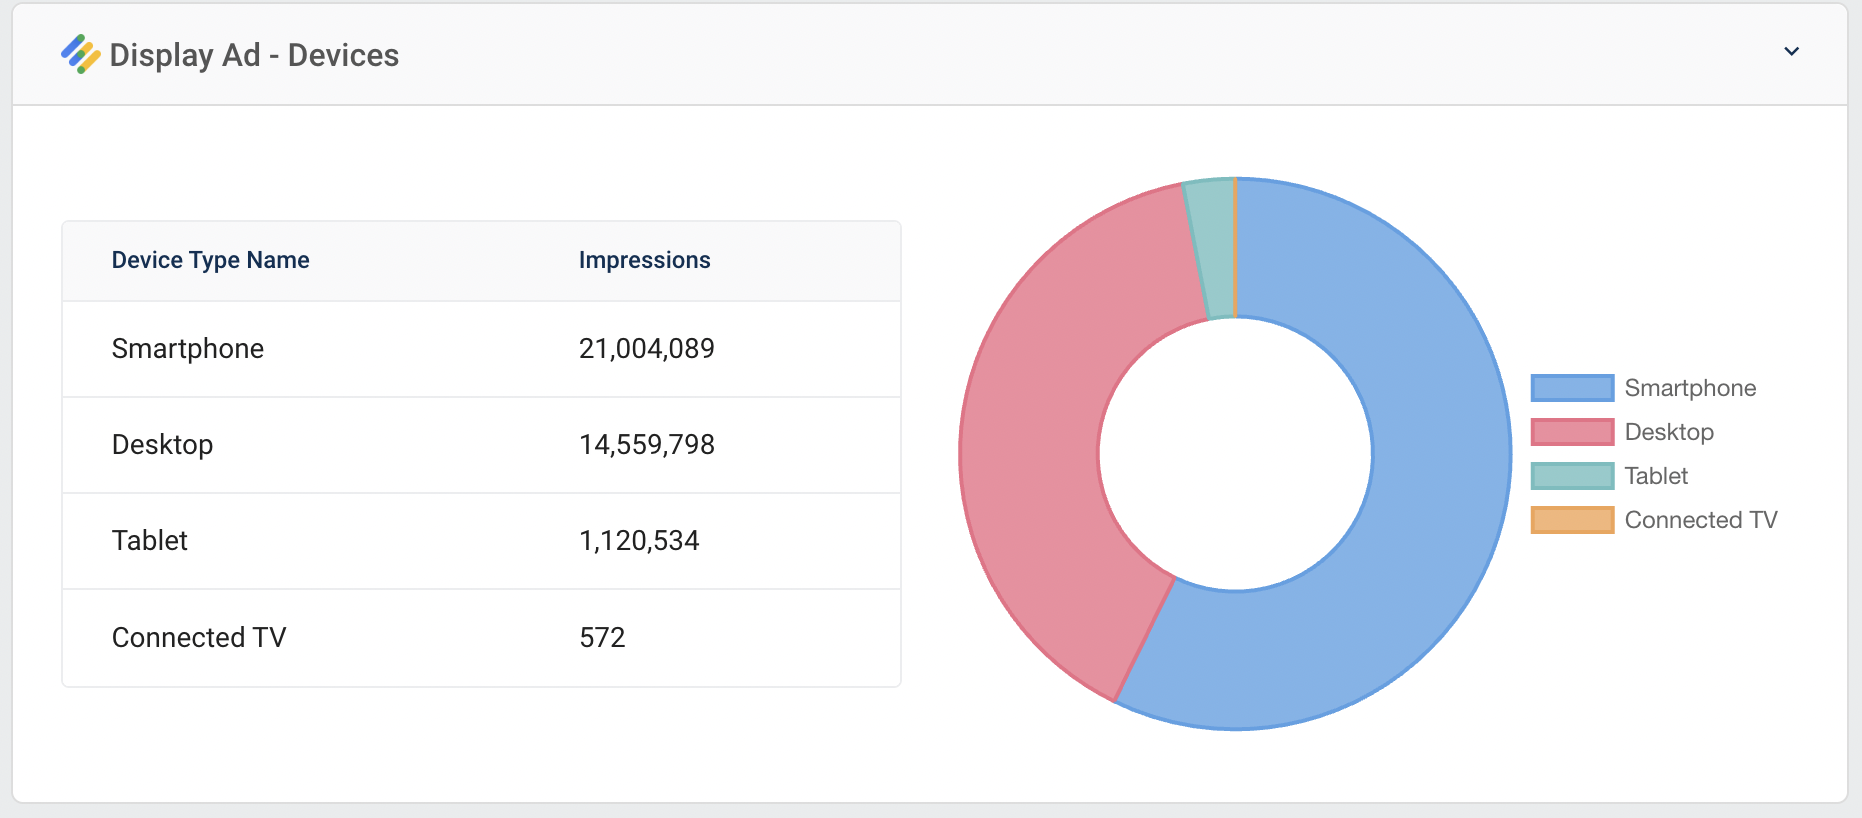
Number & Chart Widgets
The standard format of Custom Reports includes up to 4 ‘highlight’ metrics across the top followed by components that are composed of chart widgets (Table, Line, Bar, Pie, Pivot)
📍Learn more about the 'data admin' permission and how you can create report components specific to your reporting use cases.
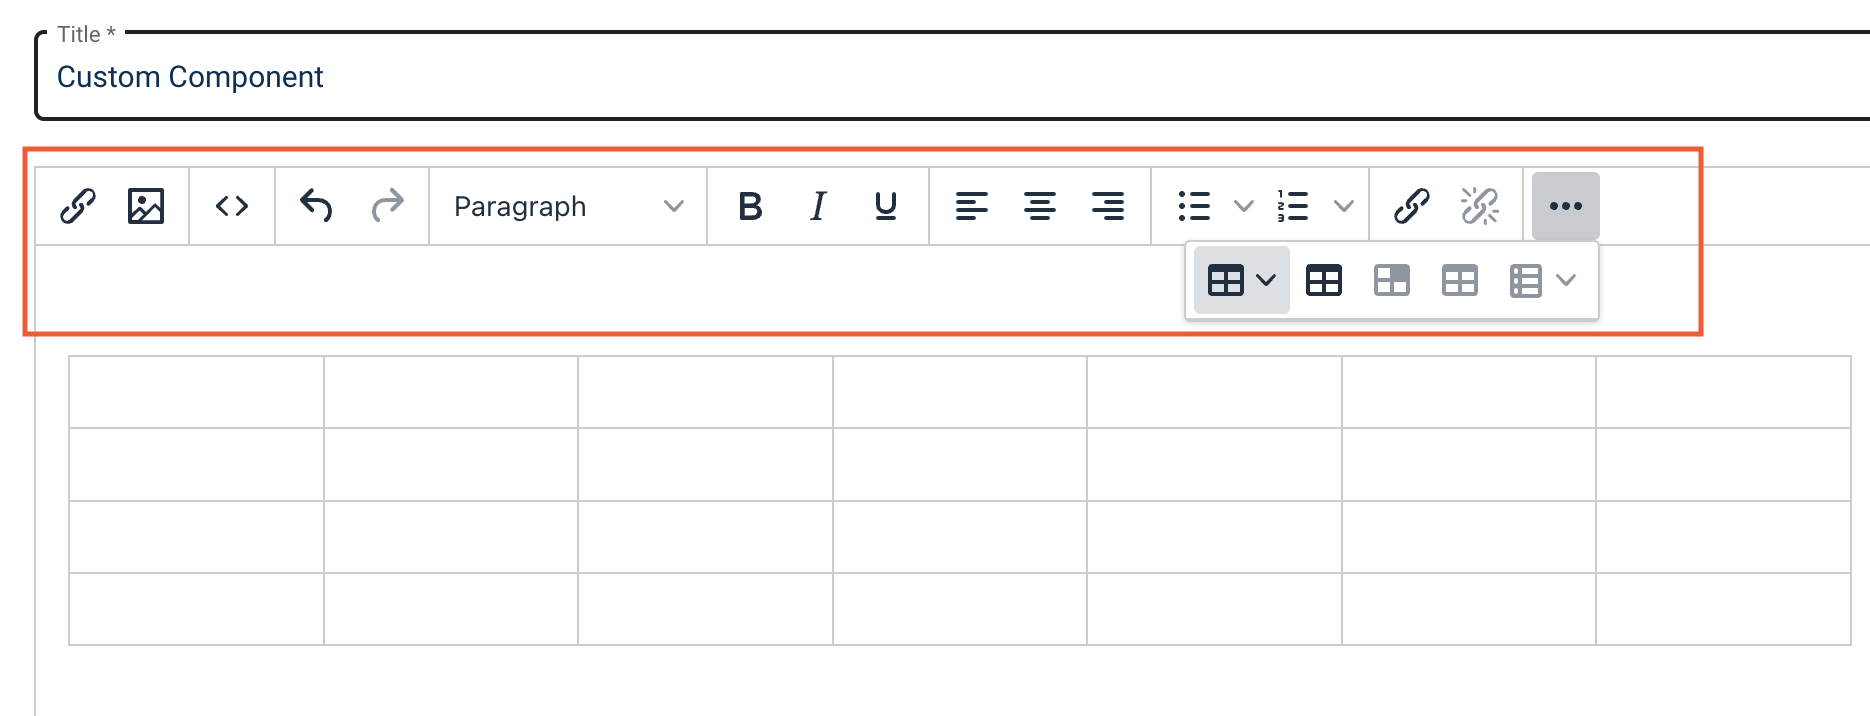
Custom Component
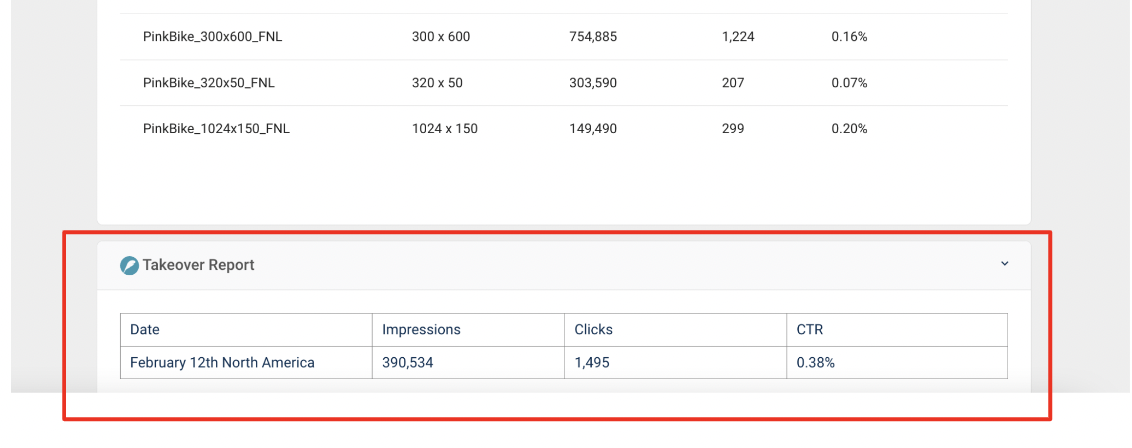
This is a 'catch all' type component useful for inserting extraneous information including images/screenshots, commentary and external reporting data. Some use cases include, providing relevant historical 'benchmarks', metrics 'definitions', commentary and/or data from another amplification channel.
🖼️ Inspiration
'Share URL' Reports
These sample reports demonstrate the types of 'Share URL' reports you can build for your clients or for your content business stakeholders:
Display Only Campaign Example: New York Times + Intuit
Branded Content Report: USAToday + Destination British Columbia
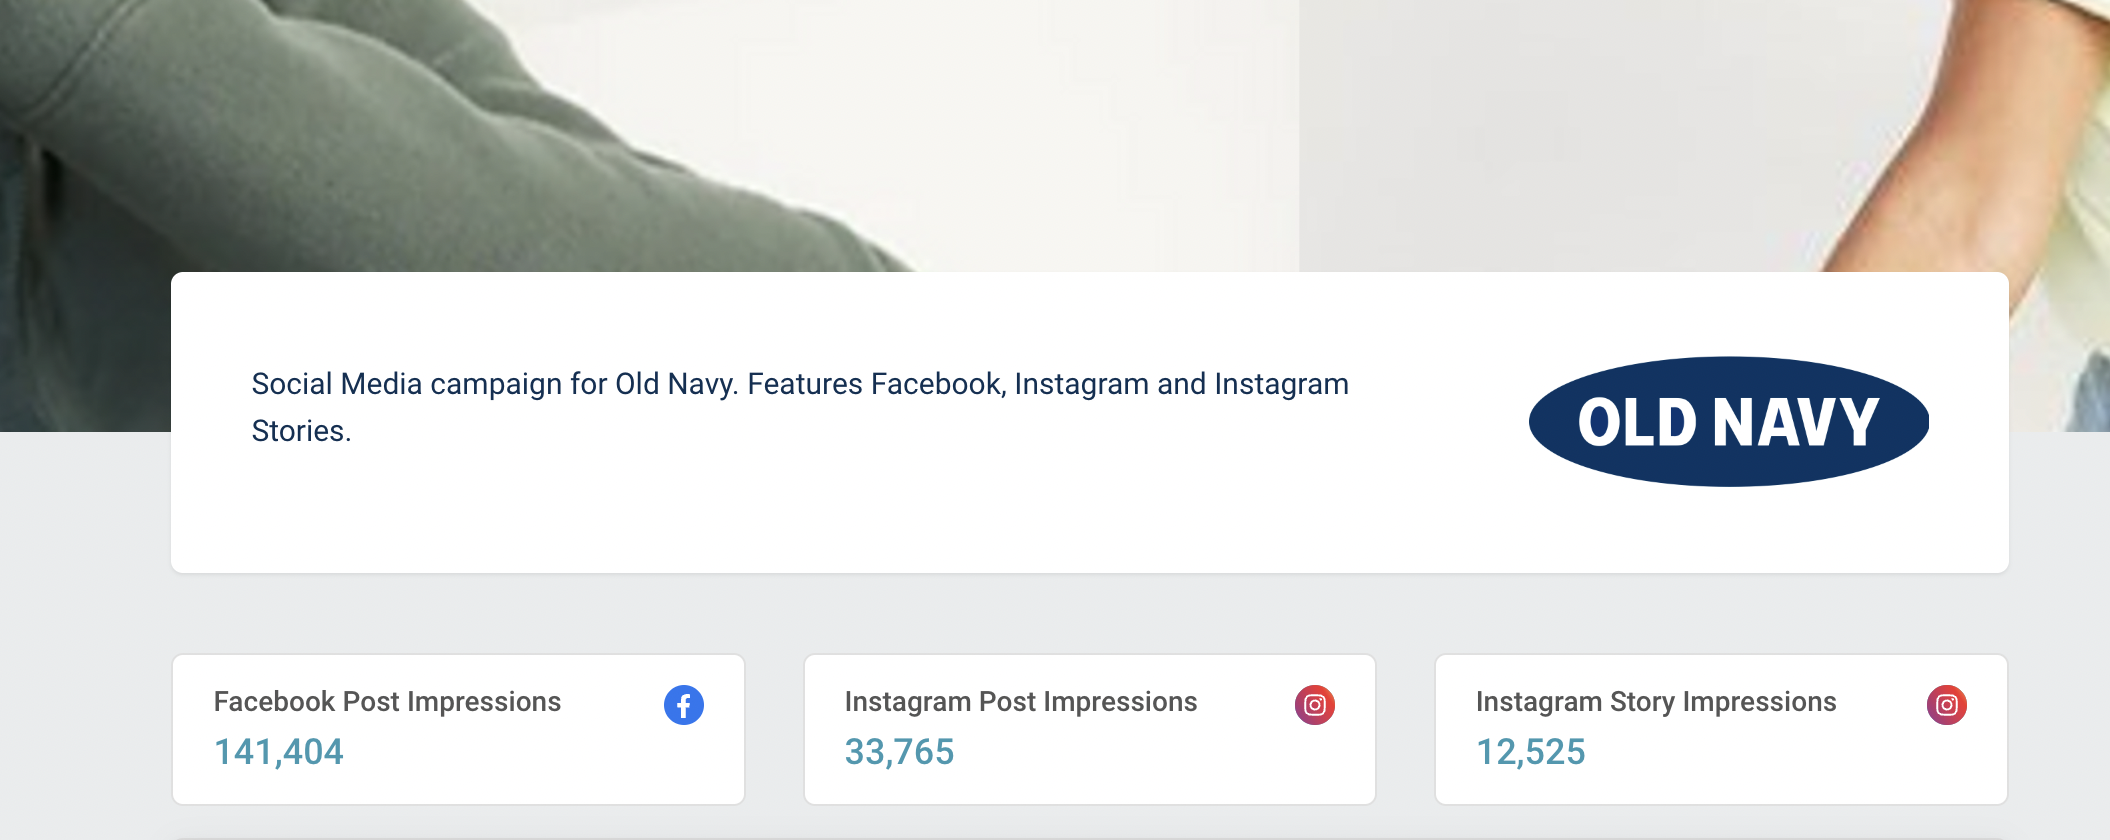
Paid Social Campaign: Narcity Media + Old Navy
Affiliate Program Report: Glacier Media + Multiple Merchants
We have added an interactive date filter so end users (recipients of the Share URL) can view data for any date range they choose, rather than lifetime or data corresponding to the start/end dates of the Custom Report. 
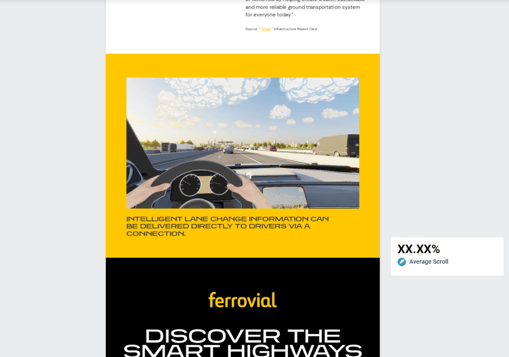
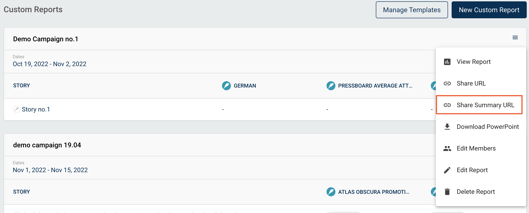
'Share Summary URL' Reports
For all custom reports that contain native content URLs, create a snapshot of performance, including up to 4 x highlight metrics and full page screenshot of the article content. This is a great way to show off content while also giving clients a look at the performance metrics they care about most.
As the recipient scrolls down the page, your selected metrics will show up in the left and right margins.