Report Components Guide
A recap of the types of widgets you can build into your report components to populate data in Campaign and Custom Reports.
Report Components UI
For access, reach out to our Customer Success Manager for the permission to be enabled for your user. Once granted, you will navigate to Report Components workflow from the main menu.

Story Reports UI
Scroll to this section for more information.
Component Types
- Highlight: a single number, directly related to the metric
- Chart: includes up to four highlights and two charts
Component Builder
Enter the workflow by clicking on 'New Component' in the top right

You will see two options, corresponding to either a 'Highlight' or 'Chart' component type in the workflow.

Examples of Components
A 'Highlight' is composed of a 'Number' widget and corresponds to any of the metrics displayed at the top of a Custom Report (Share URL). User can add up to four of these when building out a Custom Report.
A 'Chart' widget can include a combination of a up to four Highlights and up two Charts. We support many types including; Table, Line, Bar, Pie.


How to build a new Highlight
- Select 'Highlight' under component type
- Complete all fields with an asterisks (*)
- In the component builder section, either select a pre-existing 'Number' widget by searching or create 'New Widget'

- After selecting 'New Widget', select a single metric (this should be a metric for which a Highlight doesn't already exist in the component library) and add a name

- Select 'Number' from the Chart Type dropdown before saving, don't forget!

How to build a Chart
- Start with selecting any Number widgets / Highlights, if relevant, and scroll down to select a Chart widget by searching. If building an entirely new Chart, select 'New Widget'

- Chart type must be set to anything other than 'Number', see dropdown for more options

- Ensure you select a dimension (indicated purple) before adding metrics (indicated green)

Universal dimensions to use in chart widgets:
Report Name; use this to populate in the name of the report, this corresponds to the same line item as what you see in the Campaign workflow for any report type. This can be used universally across any data source

Other useful dimensions include; Story Campaign Name, Story Name, Story Property Name, Story Advertiser Name, Story Organization Name, Story Label Name, Story Label Value, Report Type.
Adding Components to Story Reports
The Story report is what you find in the Campaign UI, once reports are added to Stories: 
To add any report component to a Story report, follow the steps outlined below:
Head to Story Reports from the main menu and click to edit next to the Report type.
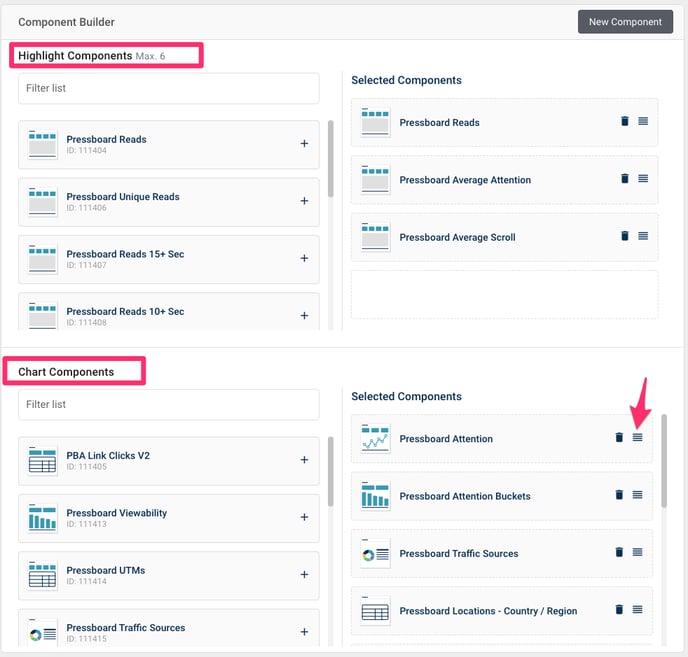
You're taken to the edit screen for the existing Story Report broken down into Highlight Components and Chart Components. Note, up to six Highlights can be selected to display in each Story summary.
Feel free to add, delete or reorder the components as needed by dragging up and down. 
Highlight components load for each report type in the Reports. You have allowance for up to six individual metrics to display for your reports as a summary of performance.

Chart components load when you select the View Reports option for any Report Type.
