June 4th, 2021
Pressboard's Data Explorer BETA feature is LIVE!
How to build queries & save them as presets
What is it?
The Data Explorer allows Pressboard Studio Users to generate their own benchmarks on the fly along with hundreds of other data points based on your organization's activity as a whole. All starting from a 30,000 foot birds-eye view.
You can easily answer questions like:
i. How many Pressboards Reads and / or Google Page-Views have our sponsored content programs delivered over X amount of time? What were the traffic sources?
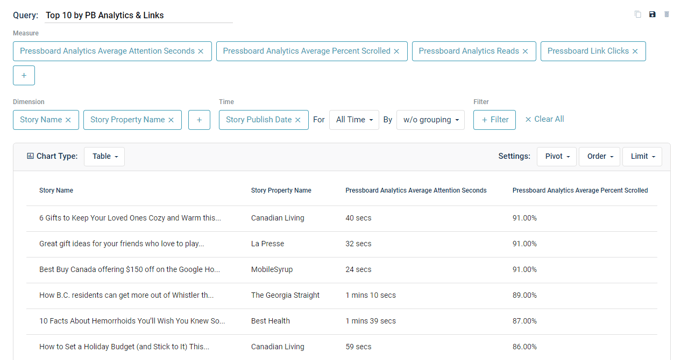
ii. What are our TOP performing Stories / Campaigns over X time across metrics that we typically report on? Which Property typically performs best?
iii. What were our previous quarter's benchmarks for (X/Y/Z) metrics broken down by User added Labels (i.e: Industry, Objective, Format, etc)? What are our benchmarks in general?
And much, much more!
How to access?
Your personal User must have existing access or be invited to your organization's Pressboard Studio account AND then upgraded to be given the "Data Explorer" permission. Please see the video below on how to gain access yourself (as an Admin) and / or grant another (Admin or Standard) User access to the Data Explorer feature.
How to build queries?
The Data Explorer BETA feature is a powerful tool. Please review the video demonstration below on how to build a basic query or jump to our step by step instructions (text) further below.
To build queries, you need THREE basic ingredients in place before launching a query:
i. Choose your Measures - Metrics such as Pressboard Reads, Pressboard Avg. Attention Seconds, Facebook Ad Set Link Clicks, Google Time Spent, etc.
ii. Choose your Timeline - Whether it's benchmarks for All-Time, Last Quarter or Last Month, you have several options to choose from.
NOTE: When building a query that includes Measures from different Data sources (ex: Pressboard Reads AND Google Page-Views), it's important to choose 'Story Publish Date' under the 'Time' parameter, followed by your chosen timeline. Why? In Pressboard, all data sources have their own time stamps. Story Publish Date acts as the connective tissue between the time stamps of data sources that are different from each other.
iii. Choose your Dimensions - How do you want your metrics broken down? You can choose criteria like 'Story' / 'Campaign' Name, 'Story Property', 'Story Advertiser', and more. This allows you to change a report from showing generalized results, to results specific to Stories / Campaigns, etc, which can then be re-ordered to understand your Top Performers based on your chosen Measures.
iv. OPTIONAL - Apply a Filter - Applying a filter will isolate your results to your chosen Filter. For example: A query showing Pressboard Analytics metrics may initially be based on ALL Traffic Sources which converted to Pressboard Reads. But, you could also apply a Filter like 'Pressboard Analytics Traffic Source' = "Facebook" to see your average benchmarks specific to traffic that was observed to be coming from Facebook in isolation (or another traffic source or in combinations).
Lastly, if you know you'll need to run the same query on a frequent basis, remember to save your query as a Preset.
As always, please reach out to your Pressboard rep if you would like a hands-on training session. Otherwise, we encourage you to get comfortable with this feature by running your own reports and would love to hear your feedback along the way.
Thank you,
Pressboard Team