One of the most powerful aspects of the Pressboard Studio is reporting. The reporting dashboard provides an eagle's eye view of a content program's performance, while also giving you the option to dive deeper into granular results.
There are two primary ways in which campaign performance can be observed:
You can jump straight to creating a Custom Report (allows User to generate an externally share-able dashboard for non-platform stakeholders) to view aggregate results for a campaign, or by viewing reports for an individual piece of content and/or social/promotional post analytics.
Here are the various integrations currently available in Pressboard Studio:
- 🔎 CONTENT analytics integrations (click to section)
- 📱 SOCIAL integrations (click to section)
- 🖥️ OFFSITE, DISPLAY & NATIVE integrations (click to section)
- 💌 EMAIL integrations (click to section)
- 📹 VIDEO integrations (click to section)
- 🎤 PODCAST integrations (click to section
- 📈 OTHER integrations (click to section)
🔎 CONTENT ANALYTICS Click on each section to learn more
![]() Google Analytics Dynamic Filter
Google Analytics Dynamic Filter
📱 SOCIAL Click on each section to learn more
🖥️ OFFSITE, DISPLAY & NATIVE Click on each section to learn more
💌 EMAIL Click on each section to learn more ![]() Campaign Monitor
Campaign Monitor
![]() Hubspot Campaigns (Email Marketing)
Hubspot Campaigns (Email Marketing)
📹 VIDEO Click on each section to learn more
🎤 PODCAST Click on each section to learn more
📈 OTHER Click on each section to learn more![]() Promotions
Promotions
![]() PRESSBOARD ANALYTICS
PRESSBOARD ANALYTICS
The screenshots and descriptions below explain what each section of Pressboard Analytics means:
- Attention
- Attention Buckets
- Traffic Sources
- Locations
- Viewability
- Devices
- Links
1. Attention
How active are your readers? Say goodbye to clicks and impressions. Attention measurement takes content analysis to a whole new level. Our technology analyzes active reading time, from mouse movements, to scrolling behavior, to location on the story page. Find out not only if a story is engaging, but where readers are dropping off.
- Date Range: Visual representation of the number of reads over the set date range. Click the dates filter to change the date range for all report data
- Reads: Number of reads on the story. This is measured based on the number of page views on the web page itself or total number of times the article/page was loaded.
- Average Active Time: The amount of time actively spent on-page based on an average across all readers. Active reading is calculated by following mouse movements and scrolling behavior. This is a vastly different measurement from Google Analytics’ time spent, which doesn't take into account active versus dormant time on the page
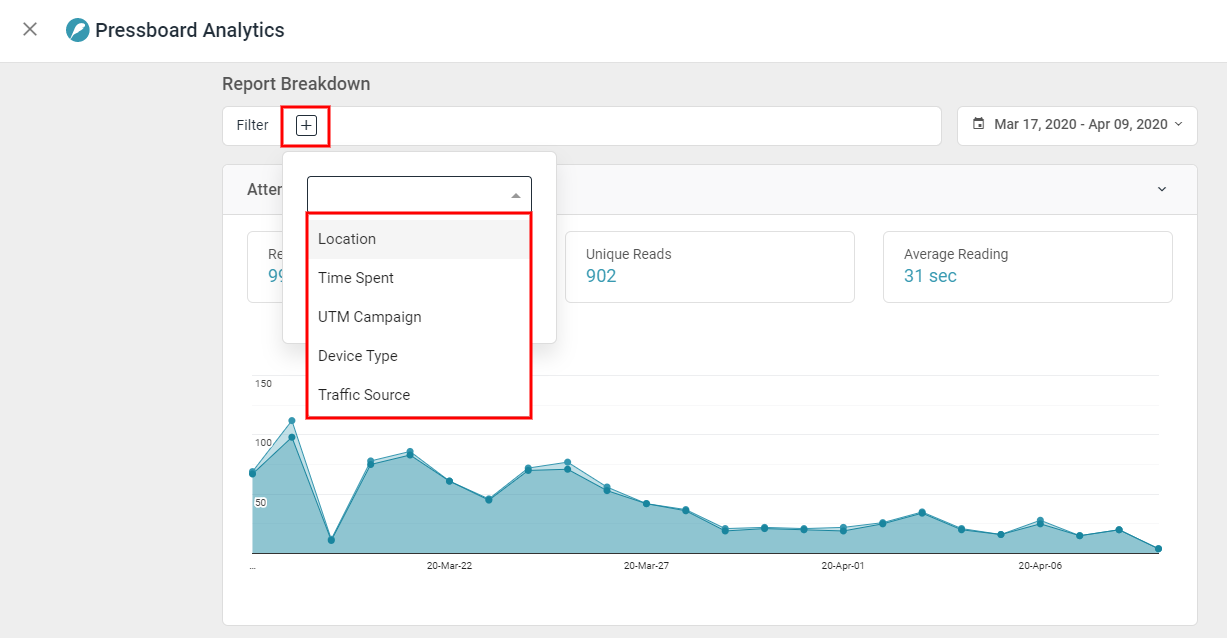
NEW - Report Filters
Just above the Attention module, you will find a list of Filters including Location, Time Spent, UTM Campaign, Traffic Sources and Device Type. In addition, you can combine and layer multiple filters to take a closer look at performance.
2. Attention Buckets
This report allows you to group reads by the average active reading time to see where the majority of your readers sit in engagement time. There are two static highlights above the graph:
i. Reads 10+ sec (Reads 15+ Sec alternatively)
Easily see what volume of Reads were over 10+ seconds based on Pressboard Active Time.
ii. Engaged Rate 10+ sec (Engaged Rate 15+ Sec alternatively)
Easily see what percentage of your Total Reads were over 10+ seconds, based on Pressboard Active Time.
Methodology: When Pressboard Analytics javascript loads on content, it acts as a 'heartbeat' on the page, measuring every second of active, human-like, engagement behaviour determined by clicking and scrolling within the browser tab. Each second of active engagement behaviour is captured in an "attention-event". By validating and measuring every second of content engagement, Pressboard Analytics can identify when the audience's session crosses meaningful thresholds like the 10 or 15 second mark. These metrics are referred to as 'Engaged Reads 10+ Seconds' or 'Engaged Reads 15+ Seconds'. They are each respectively available as a Rate % metric i.e.: Number of Engaged Reads 10+ Seconds (or 15+) / Total Reads * 100.
For example: If a piece of content captured 10,000 Reads and of those 10,000 lets say 9,000 Reads were over 10+ seconds of Active Time, the Engaged Read Rate 10+ sec would then be 90%.

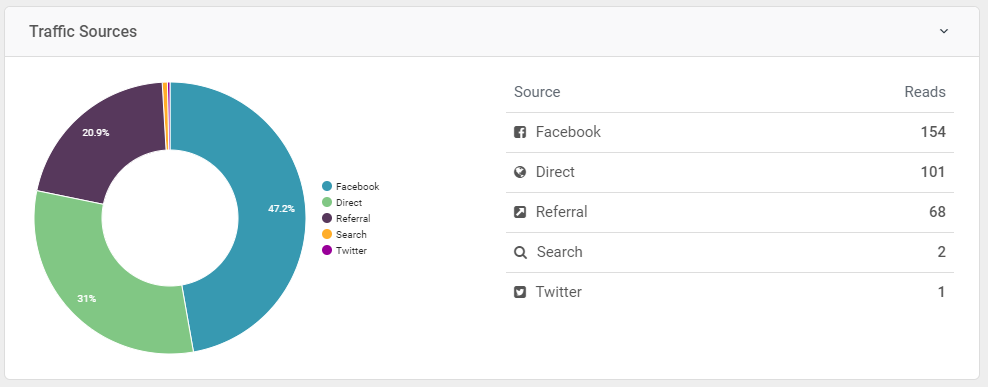
3. Traffic sources
Learn how much of the story readership is coming from social media compared to direct traffic, search traffic or referrals.
Methodology: We use the ‘Referrer’ HTTP header of the incoming request to report on the source of traffic to an article. This is standard practice and part of the open web. We use the Referrer to report on how much of the story’s readership is coming from social media compared to direct traffic, search traffic or referrals. We further break down the social traffic to see how many readers are coming from Facebook versus LinkedIn or other social platforms.
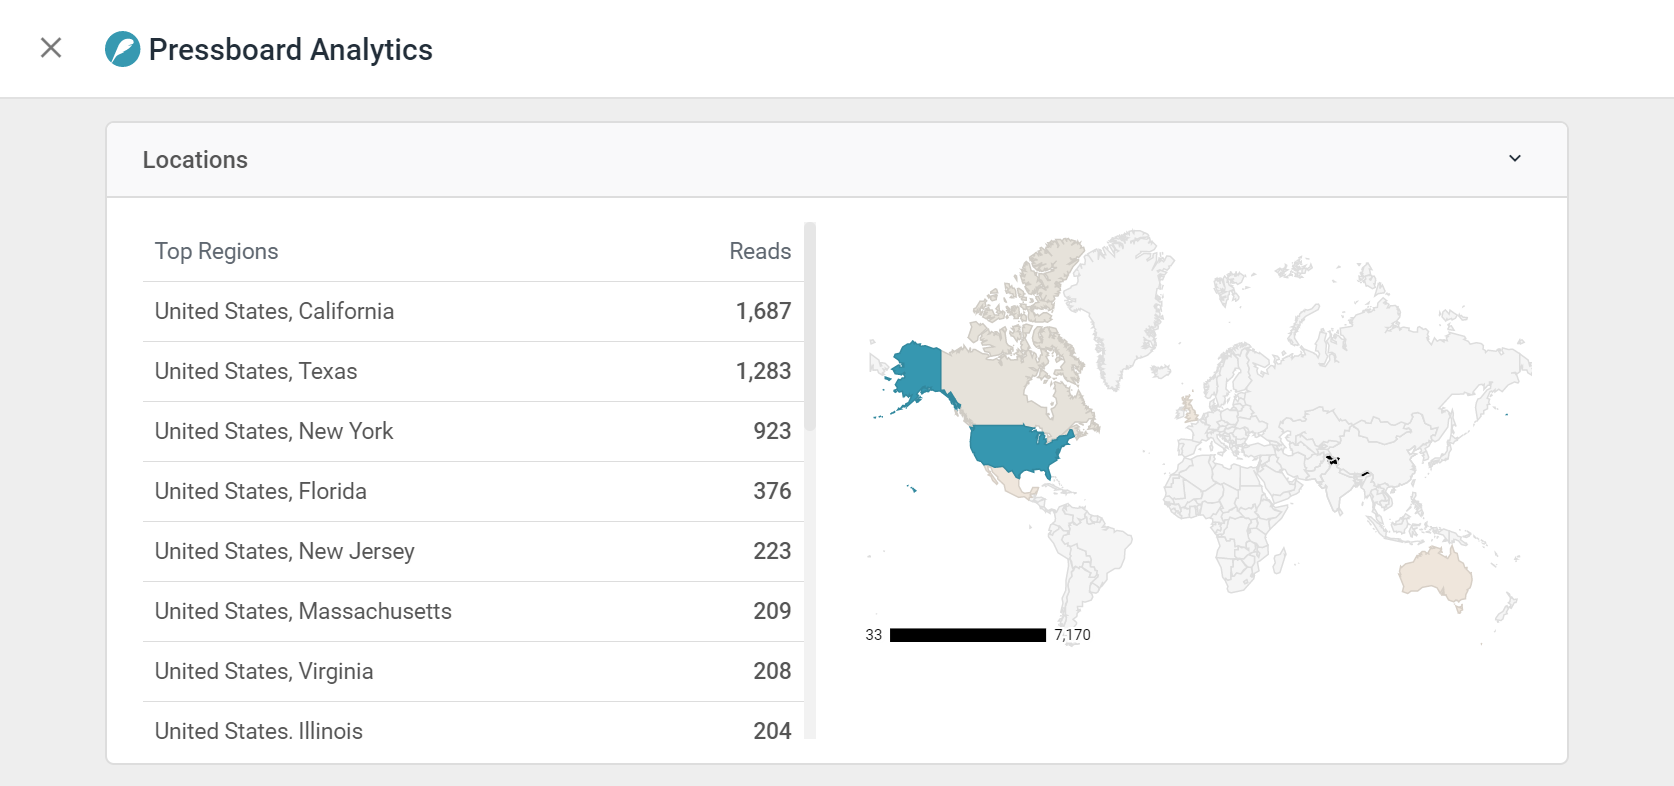
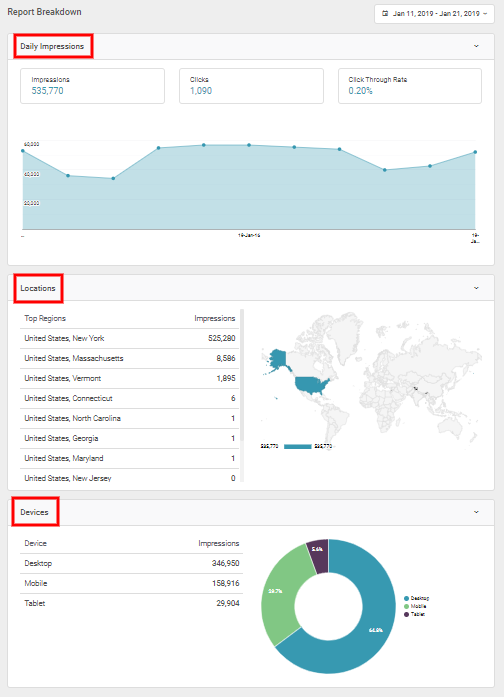
4. Locations
The locations report shows the geographic location of the reads. By clicking on the map, you can drill into and out of various countries. Break down the reads by country or even by province/state.
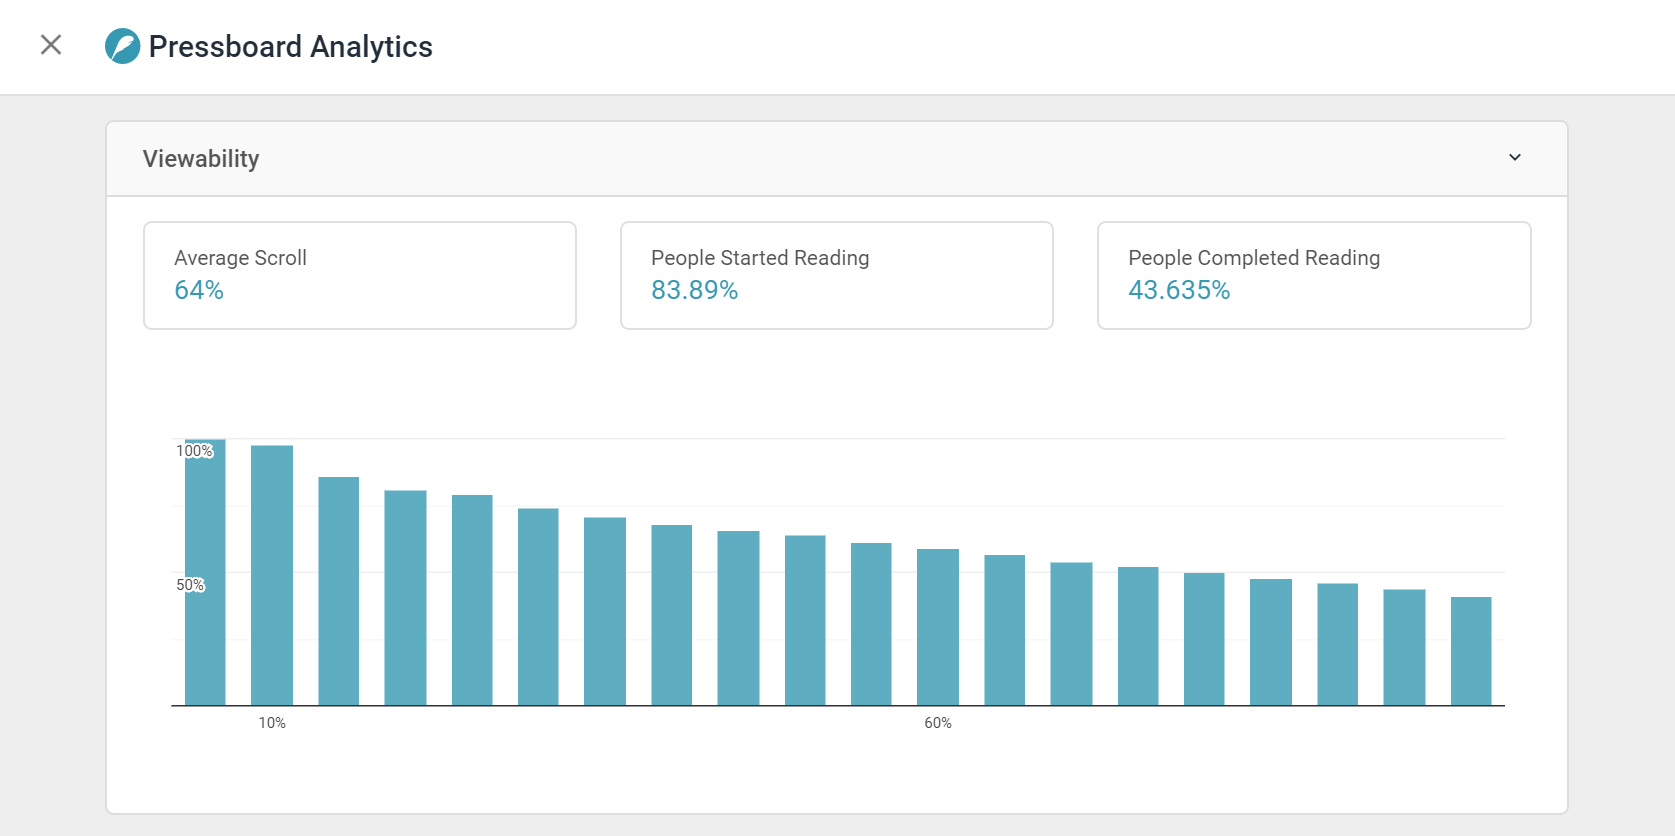
5. Viewability
The viewability report displays statistics related to scrolling behaviour (Scroll Depth %) based on an average across all readers or as a reflection of any filters you have activated. Viewability also shows where readers are dropping off in a story and how many people read the story in its entirety.
Methodology:
- Average Scroll % is determined by where the scroll depth tag is placed on-page. For accuracy, it is recommended to be placed right after the last line of article text, however, some choose to place the code at the bottom of the page, effectively including the bottom masthead space in the total height of the measurable content. Doing this may skew results (a lower average) as page visitors seldom scroll all the way down to the bottom of a page. They are more likely to bounce after reading the last line of article text or completing a video.
- People Completed Reading % calculation is determined by taking the # Reads that scrolled into the portion of the content that contains the scroll depth tag (Scroll depth tag in view = 100% Scroll measured) and dividing that quantity by the Total Reads.
- For example: If a piece of content captured 10,000 Reads, but only 4,300 Reads were observed to scroll all the way to the bottom of the content (triggering the Scroll depth tag i.e. 100% Scroll), then the People Completed Reading % for that content would be 43%.
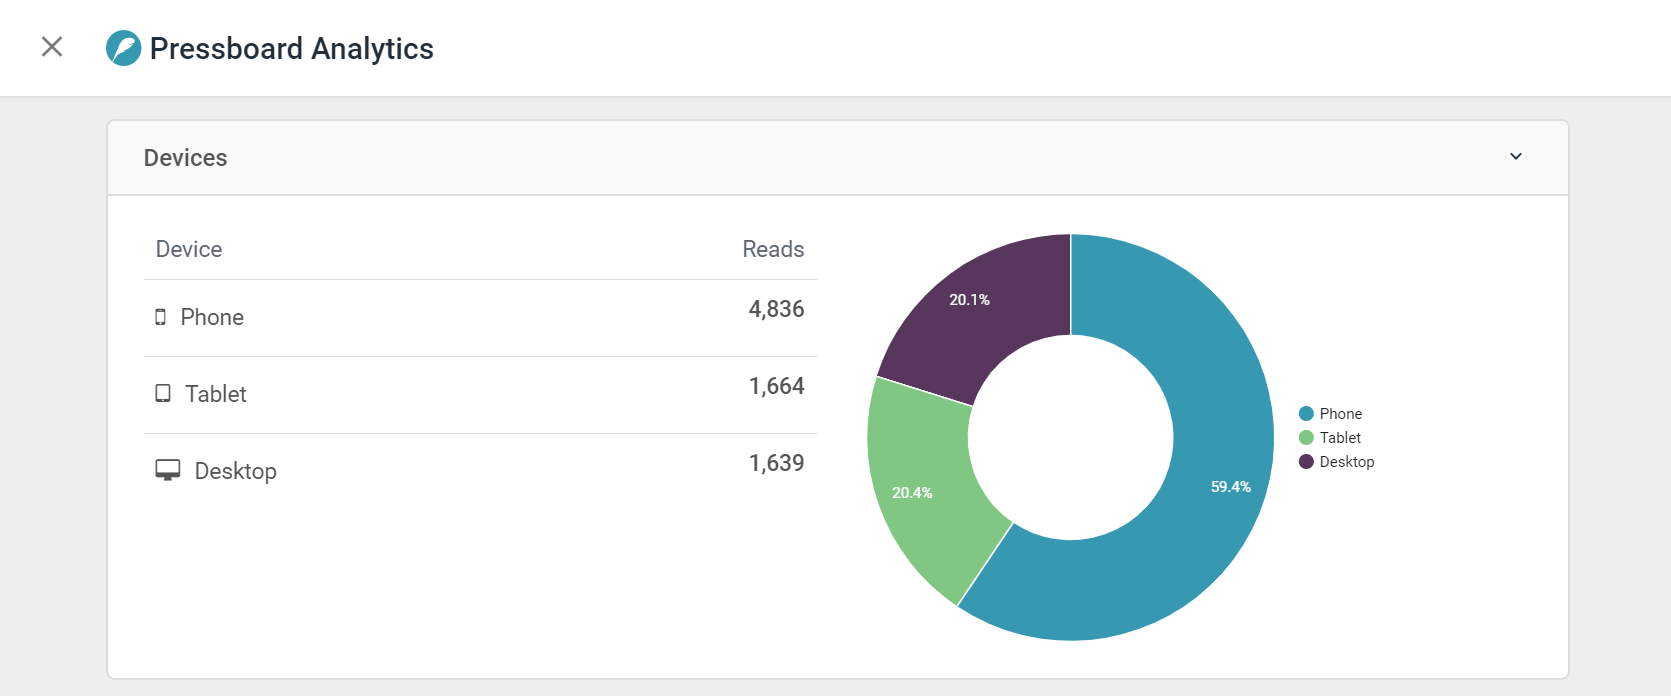
6. Devices
Learn what device readers are seeing your story on, whether it’s mobile, tablet or desktop.
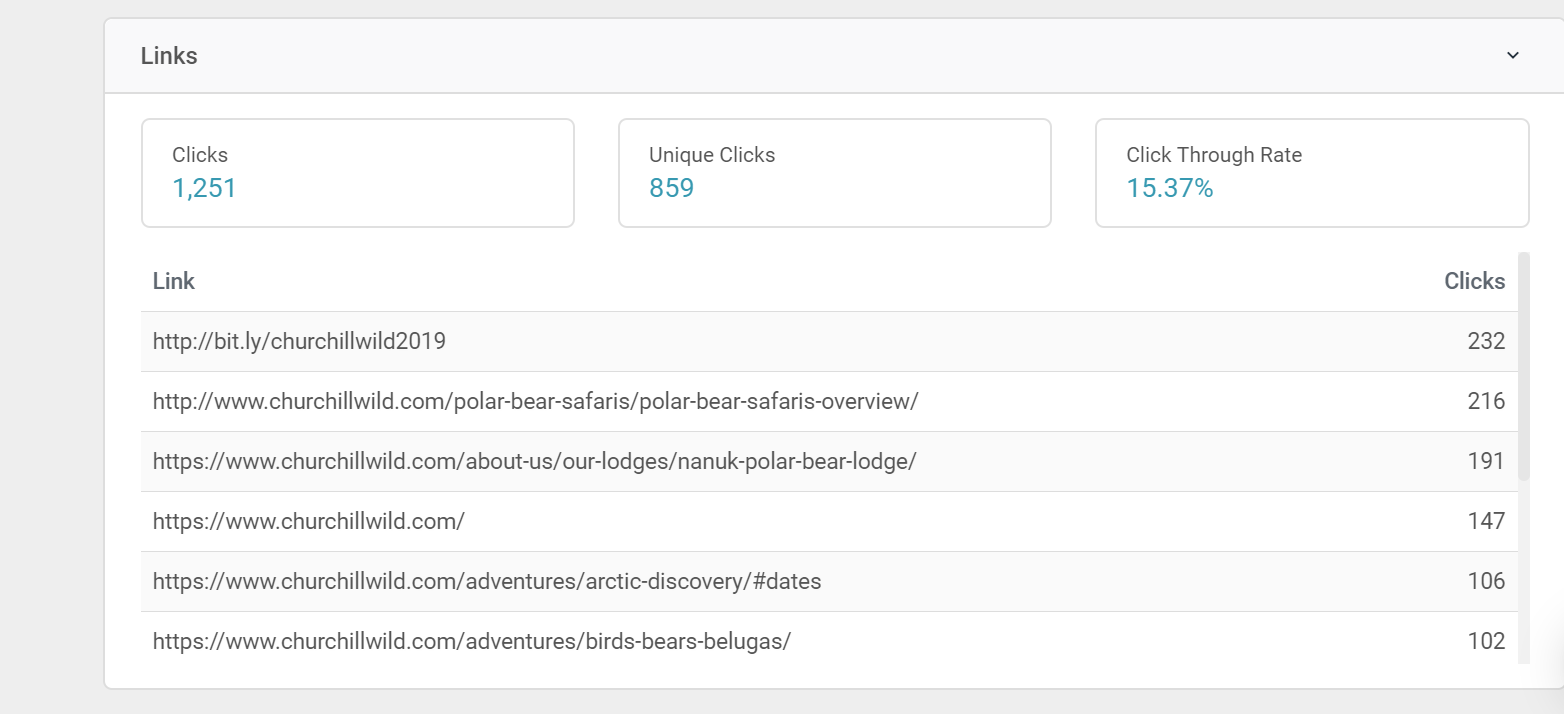
7. Links
The links report shows the number of clicks on the "Presented by" logo, the footer image, hyperlinks included in the footer message and any trackable links added to your campaign.
![]() Google Analytics Dynamic Filter
Google Analytics Dynamic Filter
- Host Name
- Page Path
- Page Title
- Landing Page
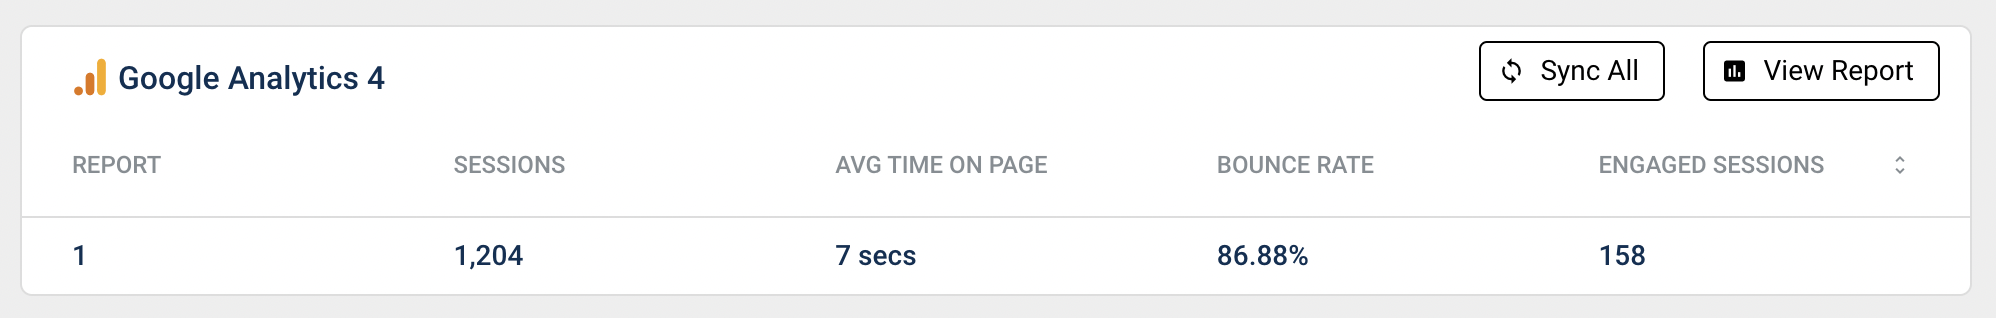
![]() Google Analytics 4
Google Analytics 4
- Age Bracket, Events, Gender
-
- Views
- Engagement Duration
- Engaged Sessions
- Engagement Rate
- Bounce Rate
- Avg Time on Page
![]() ADOBE EXPERIENCE PLATFORM
ADOBE EXPERIENCE PLATFORM
- Item ID, Performance Date
- Page Views
- Visits
- Loaded
- Bounces
- Entries
- Exits
![]() TRACKONOMICS
TRACKONOMICS
![]() GOOGLE CAMPAIGN MANAGER (formerly DoubleClick Campaign Manager)
GOOGLE CAMPAIGN MANAGER (formerly DoubleClick Campaign Manager)
- Campaign, Campaign ID, Advertiser, Creative, Creative Size, Placement, Country, DMA Region
- Impressions
- Clicks
- Active View Measurable Impressions
- Active View Viewable Impressions
- Video Completions
- Video Plays
- Video Views
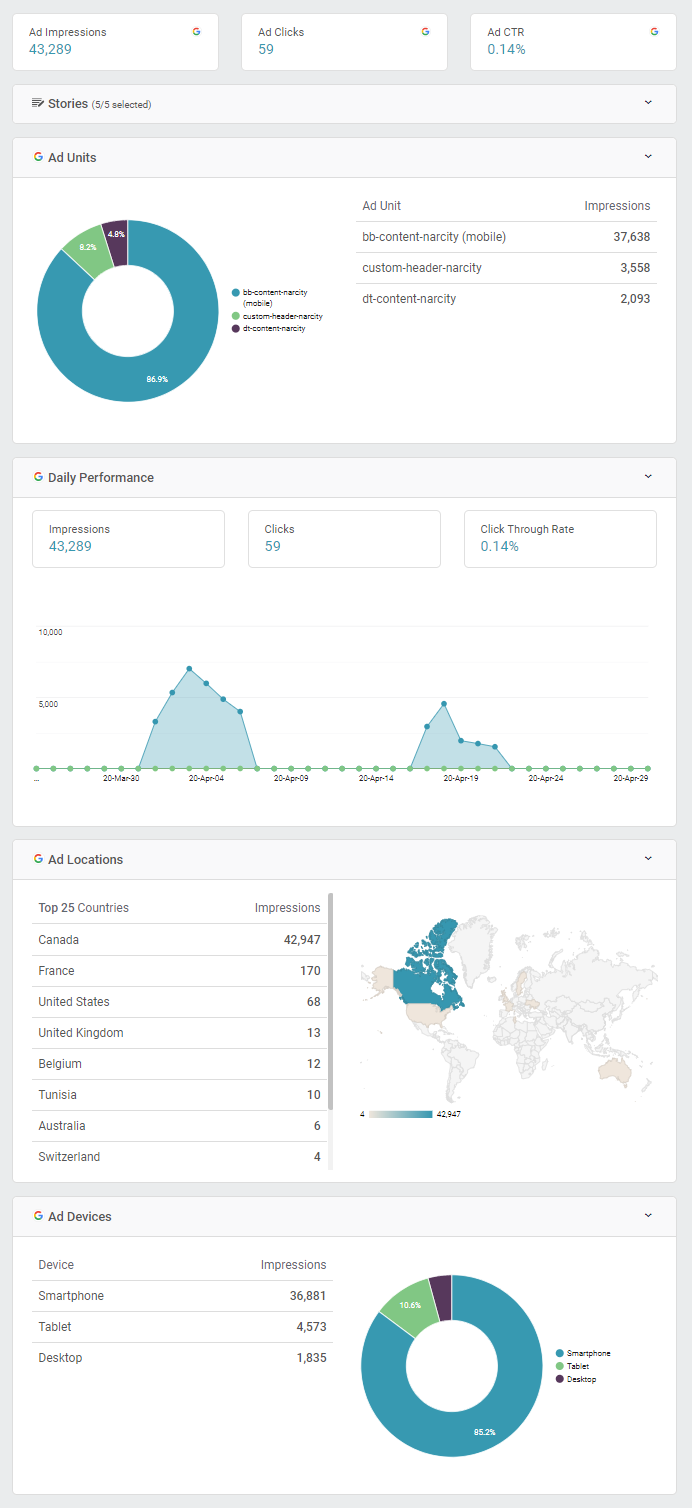
![]() GOOGLE ADS MANAGER (formerly DoubleClick for Publishers)
GOOGLE ADS MANAGER (formerly DoubleClick for Publishers)
- Display
- Ad Impressions
- Clicks
- CTR
- Locations
- Devices
- Ad Units
- NEW - Custom Criteria (key values) and Creative Sizes
- Video Views: Start, Auto Plays, Click to Plays, Average View Time
- Video Retention: Starts, First Quartile, Midpoint, Third Quartile, Completes
- Video Interactions: Pauses, Resumes, Rewinds, Mutes, Unmutes, Collapses, Expands, Full Screens, Video Skips


![]() GOOGLE ADS (Search + Display)
GOOGLE ADS (Search + Display)
- Impressions, Clicks, Click-Through Rate, Daily Performance, Devices


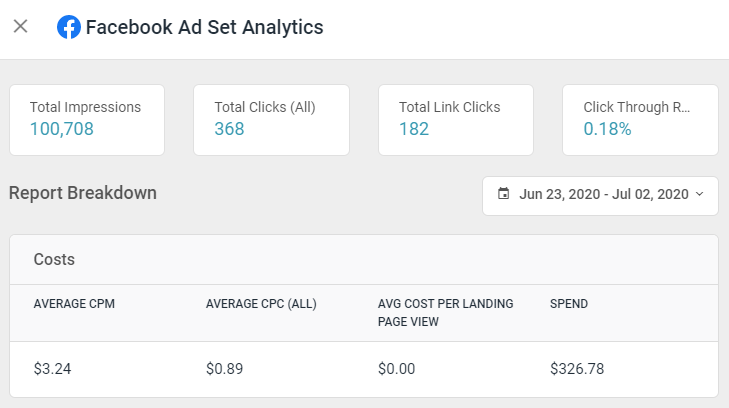
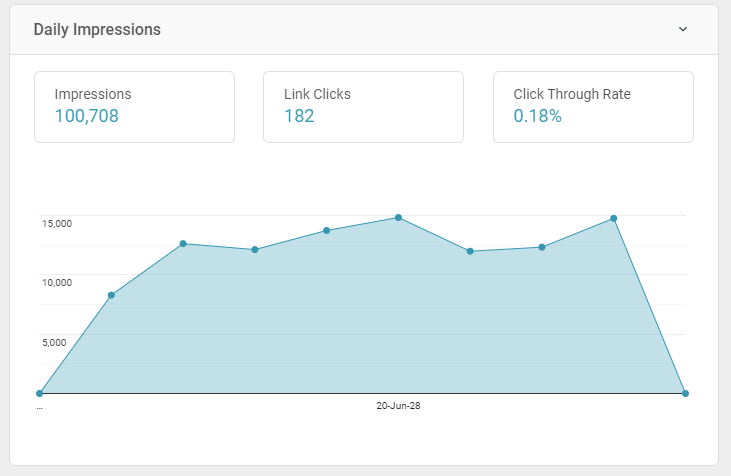
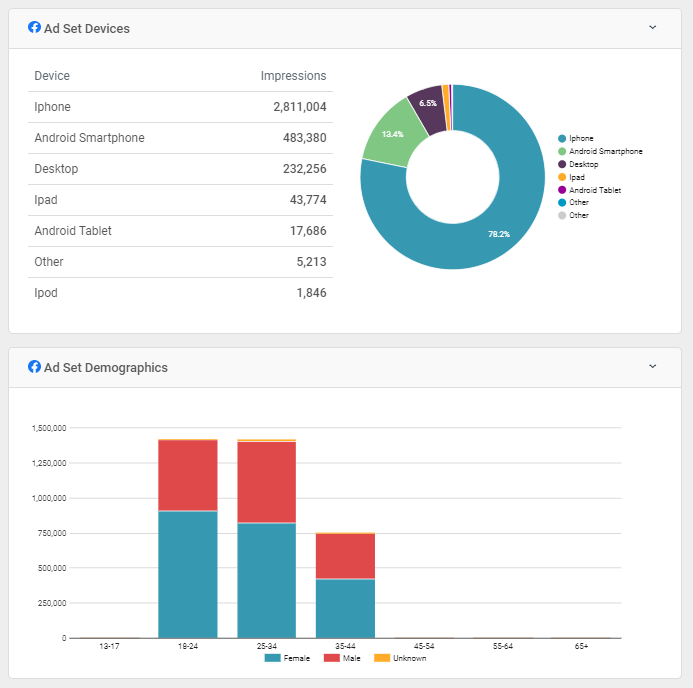
![]() FACEBOOK AD ACCOUNTS - Ad Sets & Creatives
FACEBOOK AD ACCOUNTS - Ad Sets & Creatives
- Impressions
- Clicks / URL Link Clicks
- Click-though Rate
- Reach
- Costs - Avg. CPM, CPC, Cost-Per-Landing Page-View, Spend (Total)
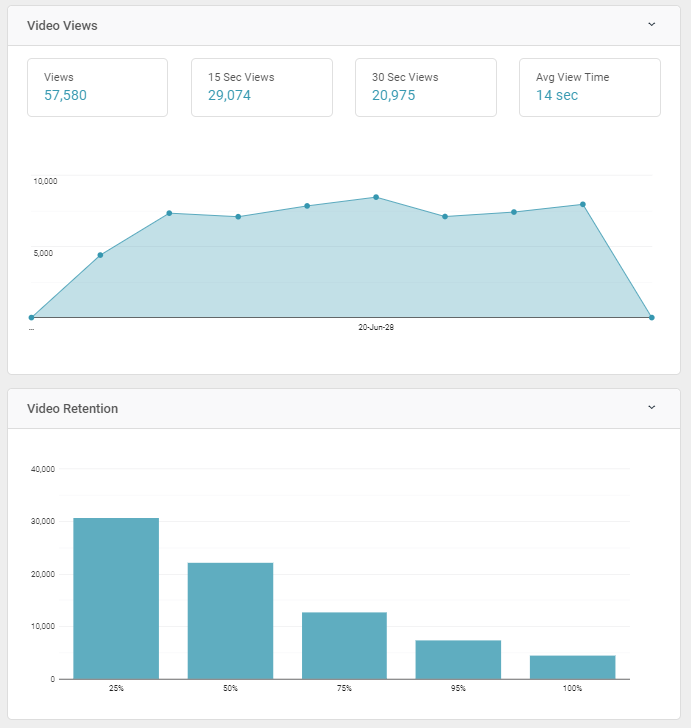
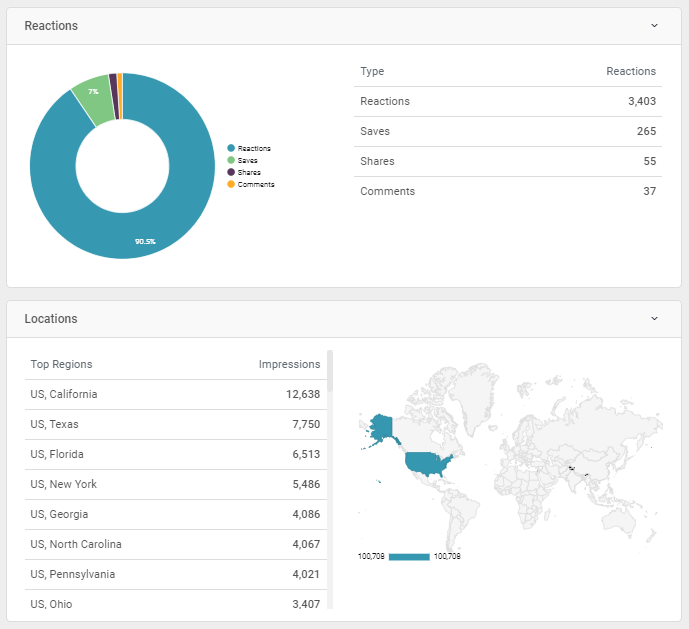
- Daily Impressions, Video Views, Video Retention, Reactions, Locations, Devices, Demographics


![]() FACEBOOK (ORGANIC)
FACEBOOK (ORGANIC)
- Post Impressions
- Post Clicks
- Post Reactions
- Post Shares
- Post Comments
.png)
![]() INSTAGRAM (ORGANIC)
INSTAGRAM (ORGANIC)
- Instagram Posts - Impressions, Engagements, Reach, # Saved, Video Views
- Instagram Stories - Impressions, Exits, Replies, Reach, Taps Forward, Taps Back
- Instagram Reels - Total Interactions, Plays, Reach, Likes, Comments, Shares, Saves
.png)

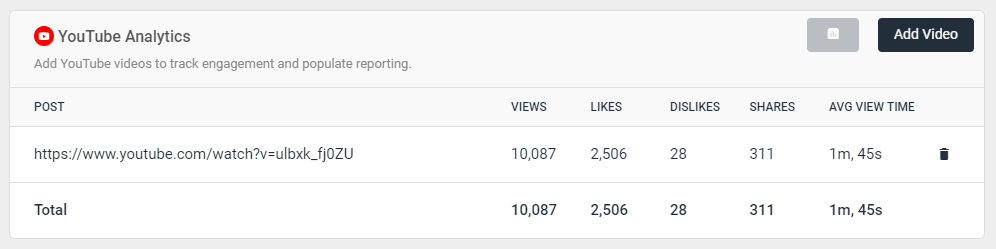
![]() YOUTUBE
YOUTUBE
- Views
- Likes
- Dislikes
- Shares
- Avg. View Time
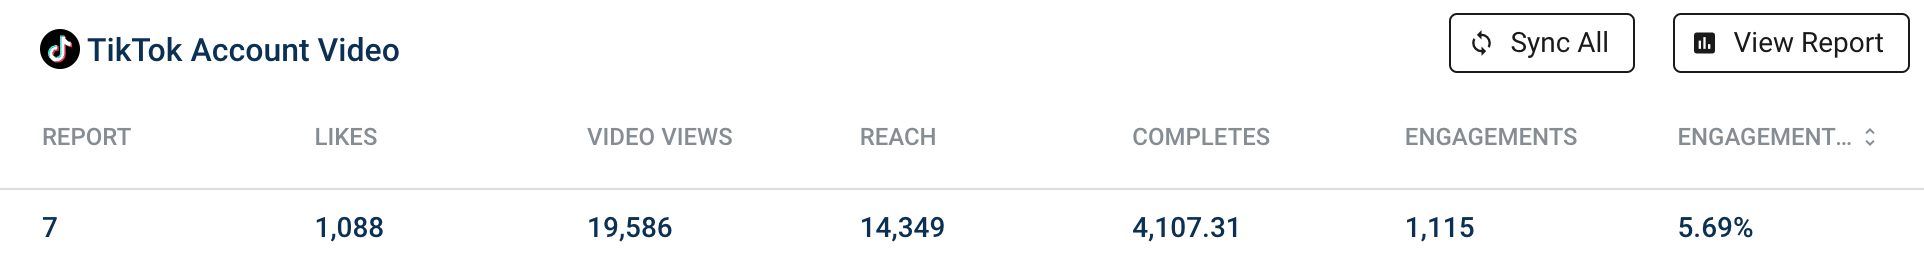
![]() TIKTOK AD ACCOUNTS
TIKTOK AD ACCOUNTS
- At Story Report level: Views, Impressions, Likes, Comments, Shares, Views, Views 6 seconds
- In Goal Tracking: All the above metrics, plus Clicks, Click Through Rate, Demographics Clicks, Demographics Click Through Rate, Reach, Result and Views (2 seconds)


- Video ID, Date, Thumbnail URL, Caption
- Video Views
- Likes
- Comments
- Shares
- Completes
- Average Time Watched
- Date, Campaign, Creative, Feed, Feed Tag, Creative Type, PO Number, Social Platform
- Impressions
- Total Clicks,
- Eligible Impressions
- Measurable Impressions
- Viewable Impressions
- Video Completions, Completion Rate
- Call to Action Clicks
- Spaceback Social Engagement metrics
![]() LINKEDIN AD ACCOUNTS
LINKEDIN AD ACCOUNTS
- Clicks
- Impressions
- Likes
- Shares
- Follows


![]() TWITTER (Organic Tweets)
TWITTER (Organic Tweets)
- Re-Tweets, Likes, Replies, Impressions, URL Link Clicks
IMPORTANT: In order to get Impressions and URL Link Clicks metrics, a Tweet must be appended to a story report within 30 days of the Tweet being posted. After 30 days, only Re-Tweets, Likes and Replies are made available through the Twitter reporting API.

![]() TWITTER AD LINE ITEMS
TWITTER AD LINE ITEMS
- Impressions
- Tweets Send
- Clicks
- URL Clicks
- Engagements
- Video Total Views

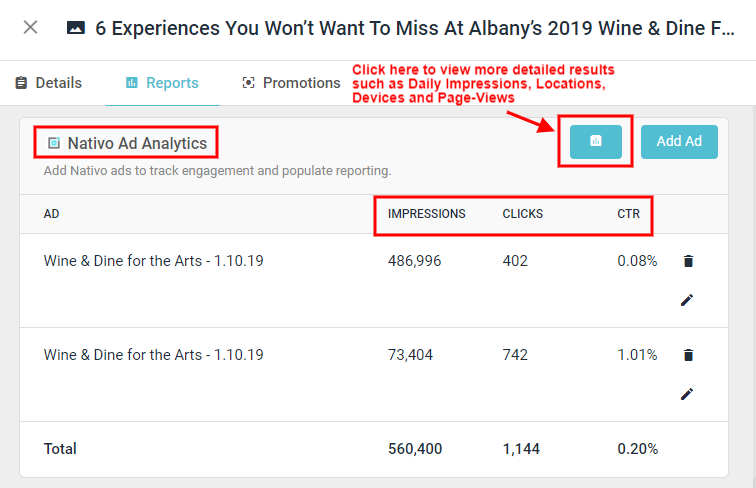
![]() NATIVO ANALYTICS
NATIVO ANALYTICS
Impressions, Clicks, CTR, Daily Impressions, Locations, Devices & Page-Views (if applicable)
![]() POLAR MEDIAVOICE CREATIVES
POLAR MEDIAVOICE CREATIVES
- Impressions, Clicks, Click-through Rate %
- Creative Instances break-down
NOTE: This integration must be activated via the platform's back-end by Pressboard's Product team. Please contact your Polar executive to confirm your Polar account's TEAM ID while simultaneously requesting them to enable API access from within Polar Mediavoice. Once acquired, the Team ID should be passed along to your Pressboard Customer Success Manager to complete set-up.

![]() STACKADAPT
STACKADAPT
- Ad ID, Native Ad ID, Date, Native Ad Type, Campaign Name, App Name
- Impressions, Clicks, Click-through Rate %
- Conversion Clicks, Conversion Cookie, Clicks Conversion Rate, Media Cost, Number of Conversions, Profit, Revenue, Revenue Cost-Per-Click. Revenue Cost-Per-Mille, Secondary Conversions, Third-party CPM Costs
- Number of Video Completions: 0%, 25%, 50%, 75%, 95%
- Total Time Spent on Page
- Unique Impressions, Unique Impressions Inverse Rate, Unique Conversions, Unique Conversions Rate


![]() AdMedia DISPLAY
AdMedia DISPLAY
- Impressions, Clicks, Click-Through Rate %
- Genders, Age Brackets


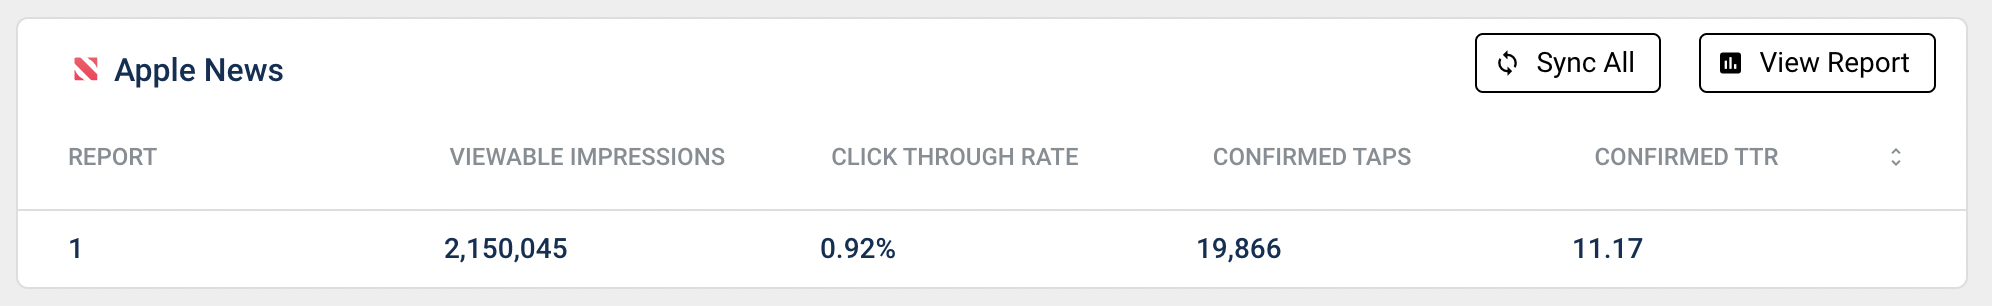
![]() Apple News
Apple News
- Campaign ID, Campaign Name, Line ID, Line Name, Date
- Confirmed TTR
- Taps
- Click Through Rate
- Viewable Impressions
![]() Celtra
Celtra
- Campaign Name, Creative ID, Placement Name, Creative Format, Creative Video Length
- Requested Impressions
- Loaded Impressions
- Creative Exposure Time
- Average Exposure Time
- Ad Expansions
- Inline Video Play
- Inline Video Starts
- Inline Video Completions
- Event Type, Page Name, Experience Name, Component Name, Country, Region, City, Date
- Ceros Universal Analytics Events
- Ceros Universal Analytics Events Total Video Play Time
![]() Storied Video
Storied Video
- Video Views, Video Unique Views, Avg. Video Play %, Completion Rate


![]() ADYOULIKE
ADYOULIKE
- Placement Name, Country, Device, Date, Site Name
- Impressions
- Revenue
- Clicks
- Click Through Rate
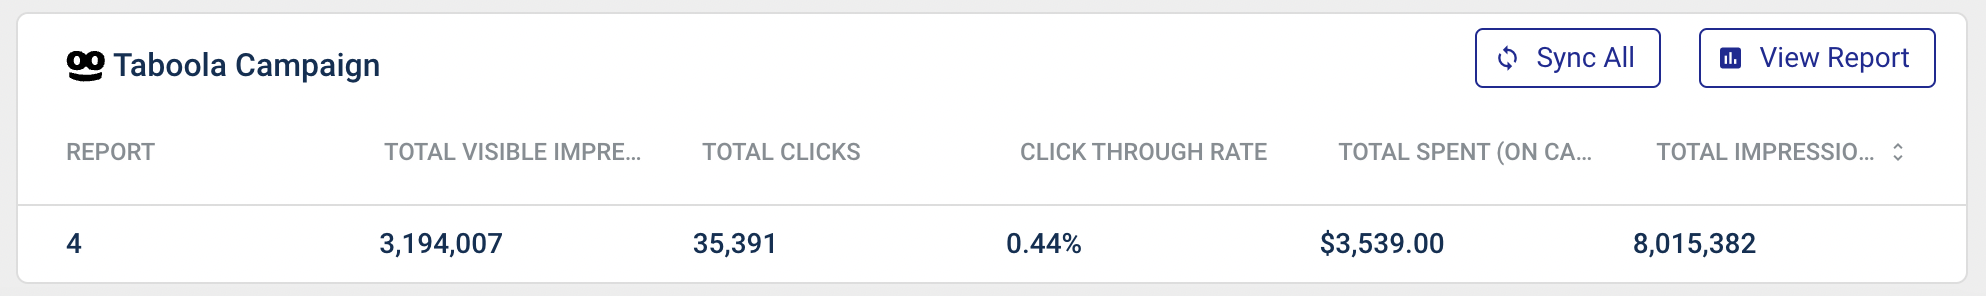
![]() TABOOLA - Display
TABOOLA - Display
- Campaign ID, Currency, Campaign Date
- Impressions
- Clicks
- CTR
- Viewable CTR
- Cost per Action (Conversion)
- Total number of Actions (Conversions)
- Total Spend
- CPM
- CPC
![]() Jetpack
Jetpack
- Date, Order ID, Order Title, Site Name, Line Item Title, Unit Type, Publisher Unit Type, Event Name
- Render Event Count
- Views Event Count
- Clicks Event Count
- Interaction Event Count
- Iframe Requested Event Count
- Footer Shown Count
- Opened Overlay Count
- Clicked Expand Count
ResponsiveAds
A dynamic ad tech platform that automatically adjusts size, appearance, and format to fit any ad space perfectly.
Note: This integration requires the creation of an S3 bucket. Please reach out to your CSM to active this connection.
- ResponsiveAds Name, Advertiser, Category, Template Type, Format, Deployment., Channel
- Click Throughs,
- Hovers
- Element Clicks
- Expands
- Light Boxes
- Article Views
- Scroll0, 25, 590, 75, 100
- Hide
- Video25, 50, 75, 100
- Video Ended
- Date, Campaign, Brand, Ad, Creative Name, Creative Size, Format
-
- Impressions
- Video Starts
- 25% Video Completions, 50%, 75%, 100%
- Total View Time
- Average View Time
- Video Completion Rate
- Date
- Impressions
- Clicks
- Conversions
- CTR, CPM, CTA
- Revenue
- New Visitors
- Video Impressions
![]() Outbrain Amplify
Outbrain Amplify
- Campaign ID, Marketer ID, Currency, Date
- Impressions
- Clicks
- Conversions
- Spend
- eCPC
- CTR
- CPA
 Integral Ad Science
To view a complete list of available metrics & dimensions, please visit 'Integral Ad Science' sections under 'Widgets' or 'Data Sources'.

![]() Brightcove Video
Brightcove Video
-
Date, Video ID, Account ID, Category, Video Name
-
Video Name
-
Video Views
-
Video Impressions
-
Average Play Rate
-
Play Requests
-
Daily Unique Viewers
-
Engagement Score
-

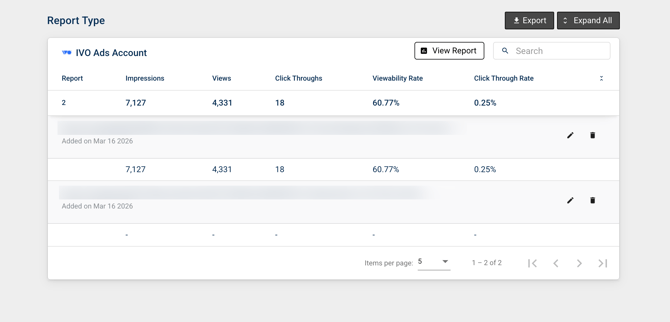
![]() IVO Ads
IVO Ads
We now support IVO, a creative enablement and advertising platform. This integration allows you to seamlessly pull and report on IVO data alongside your existing metrics, providing a more holistic view of your campaigns.
Note: To activate this integration, please contact your Customer Success representative to provide the required one-time client secret credentials.
![]() Pinterest Ads
Pinterest Ads
- Campaign ID, Ad Group ID, Ad Group Date, Campaign Name
- Impressions
- Engagements
- Clicks
- Saves
- Leads
- Video Views; 3 seconds
- Videos Views; 100%


![]() Pinterest Boards
Pinterest Boards
- Pin Pinterest Pin ID, Pin Pinterest Type, Pin Pinterest Date
- Impressions
- Saves
- Clicks
- Outbound Clicks
- Video Views
- Devices

- Campaign ID, List ID, User ID, City, Region, Country Code, Country Name, Date
- Opens
- Unique Opens
- Clicks
- Unique Clicks
![]() Mailchimp
Mailchimp
- Campaign ID, Status, Content Type, Campaign Title, List ID, Subject Line, Preview Text
- Emails Sent
- Unsubscribed
- Hard / Soft Bounces
- Forwards Count / Forwards Opens
- Total Opens / Unique Opens
- Total Clicks / Unique Clicks
- Subscriber Clicks / Unique Subscriber Clicks
- Total Orders
- Total Spent
- Total Revenue
- Open Rate / Click Rate
![]() Sailthru
Sailthru
- Campaign, URL, Device & Engagement insights
- Beacon Impressions
- Beacons
- Click Multiple URLs
- Clicks
- Confirmed Opens
- Email Opens
- Page-Views
- Revenue
- Total Clicks
- Users
- Views

![]() Iterable
Iterable
- Date, Launch Date, Campaign ID, Campaign Name
- Email Sends
- Email Opens
- Unsubscribes
- Email Click Rate
- Email Open Rate
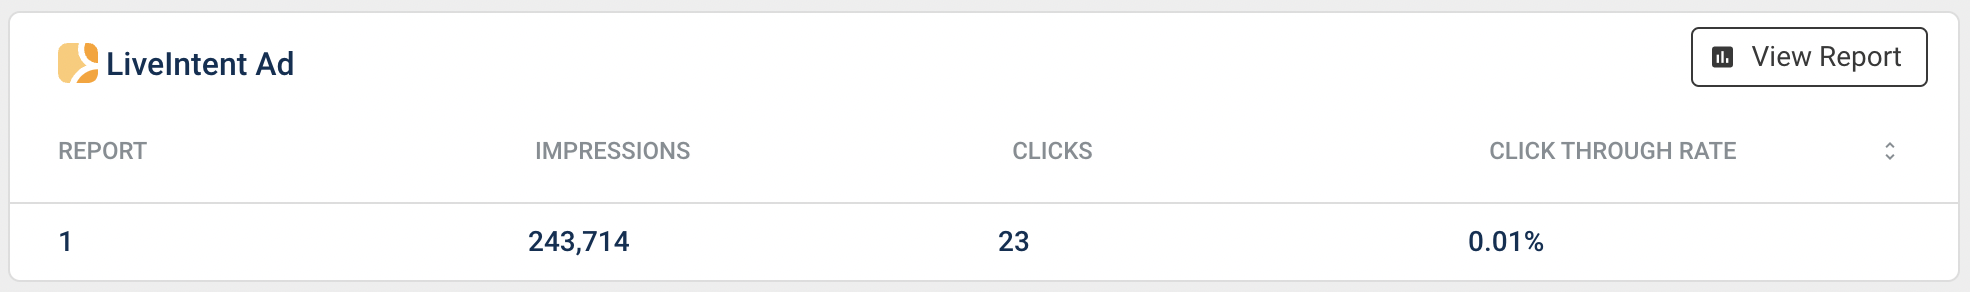
![]() LiveIntent
LiveIntent
- Campaign Name, Creative Name, Line Item, Campaign Label, Region, Gender
- Impressions
- Clicks
- Conversions
- Click Through Rate
- Post-Click Conversions (PCC)
- Post-View Conversions (PVC)
![]() Klaviyo
Klaviyo
-
- Klaviyo Opens, Clicks, Recipients, Conversions
- Klaviyo Unique Opens, Unique Clicks
- Klaviyo Delivered
- Klaviyo Open Rate, Click to Open Rate, Click Rate

![]() Hubspot Campaigns (EMS)
Hubspot Campaigns (EMS)
-
Name, Subject, Campaign ID, Campaign, Primary Email Campaign Id, Date, Created At,
Published At
- Saved
- Sent
- Delivered
- Open
- Click
- Bounce
- Unsubscribed
- Reply
- Dropped
- Selected
- Spam Report

PROMOTION ANALYTICS
Aggregate of Facebook Ad Accounts, Polar, Nativo, AdMedia, LinkedIn, Twitter Ad Line Items, Stack Adapt & Polar.
Impressions, Clicks, CTR (%)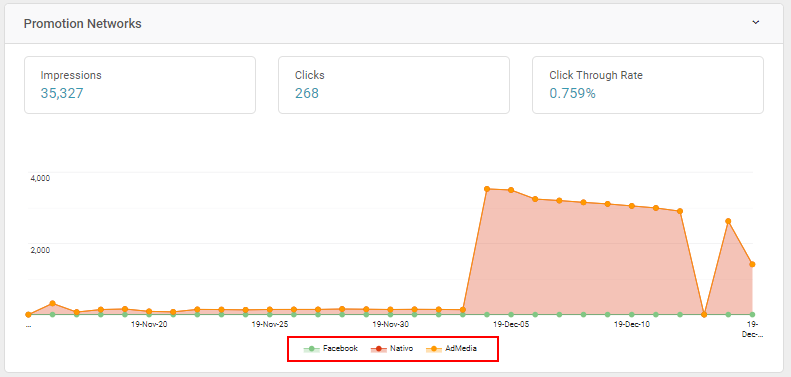
![]() CreatorIQ - creator marketing reporting
CreatorIQ - creator marketing reporting
- Campaign, Creator ID, Post ID, Brand, Influencer, Caption, Permalink, Platform
-
- Clicks
- Content Likes
- Total Engagements
- Engagement Rate
- Video Views
![]() JWPlayer - Video
JWPlayer - Video
- Media ID, Date, Page URL, Media Type, Author, Category, Description, Title
- 25% / 50% / 75% Completes
- Adjusted Completes
- Embeds
- Plays
- Time Watched
- Unique Viewers
- Duration
- Content Score
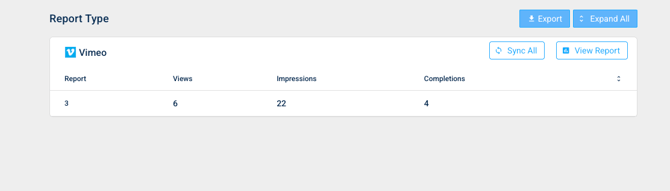
![]() Vimeo
Vimeo
A leading video hosting, sharing, and creation platform. You can add this connection by going into Settings > Data Source > Add.
Note: You will need your Vimeo Display Name and an Access Token. Learn how to generate a Vimeo access token here.
- Date, Video ID, User ID, Video URL, Video URI, Title, Video Duration, Video Created Time, Category
- Views / Unique Views
- Unique Viewers
- Impressions / Unique Impressions / Third Party Impressions
- Completions
- Likes
- Comments
- Average Play Rate
- Finishes
- Downloads
- Average Seconds Watched
- Total Seconds Watched
- Average Percent Watched
![]() NEXD Video
NEXD Video
- Impressions, Clicks Click-through Rate %
- Engagements, Engagement Rate, Dwell Time
- Video Starts, Engagement Rate (25s, 50s, 75s, 100s), Video Watched (25s, 50s, 75s, 100s)


![]() Megaphone by Spotify
Megaphone by Spotify
Note: This integration relies on client having an Enterprise-level account with Megaphone. Please click here to review the required steps in order to activate your Megaphone.
- Episode ID, Episode, Podcasts ID, Date, Country, DMA, City, Region, Duration, In Streams
-
Bytes Sent
-
Seconds Downloaded
-
Listens
-
Downloads
-
Plays
-
Unique Listens
-

![]() AudioGo by Adwizz
AudioGo by Adwizz
AudioGo is an audio advertising platform for small businesses and agencies that empowers promoting your product or service to music and podcast listeners.
-
Date, Campaign ID, Campaign Name, Advertiser ID, Advertiser Name, Agency ID
-
- Demand Audio Imp
- Demand Total Spend
- Clicks
- Click Through Rate
- Click Display
- Companion Sum
- Objective Countable Sum
- Listen Through Rate
- Demand Audio Reach Unique Users
- Date, Primary Trafficker, Advertiser, Order Name, Campaign Name, Creative Name, Third Party Name
-
- Contracted Goal
- Scheduled Impressions
- Schedules Goals
- Impressions / Impressions Third Party
- Clicks / Clicks Third Party
- Click Through Rate / Third Party Clicks Through Rate
- Impressions / Click Discrepancy Percentage
See Next: How to Connect External Data Sources to your Account
Related: How to Create Custom Reports
Did this answer your question?