A guide to using Widgets for benchmarking
Here are some simple use cases to help you lean into your data and extract deeper reporting insights.
When to get started?
- When you have enough campaigns measured, typically at least 3 months worth of performance data in your Pressboard account.
- Know what you want to measure. You have an existing framework for evaluating KPIs and performance along dimensions such as Content Type, Vertical or other elements bespoke to your business.
- Conduct periodic reporting to track progress against established benchmarks internally and/or include in advertiser reports.
Quick Demo:
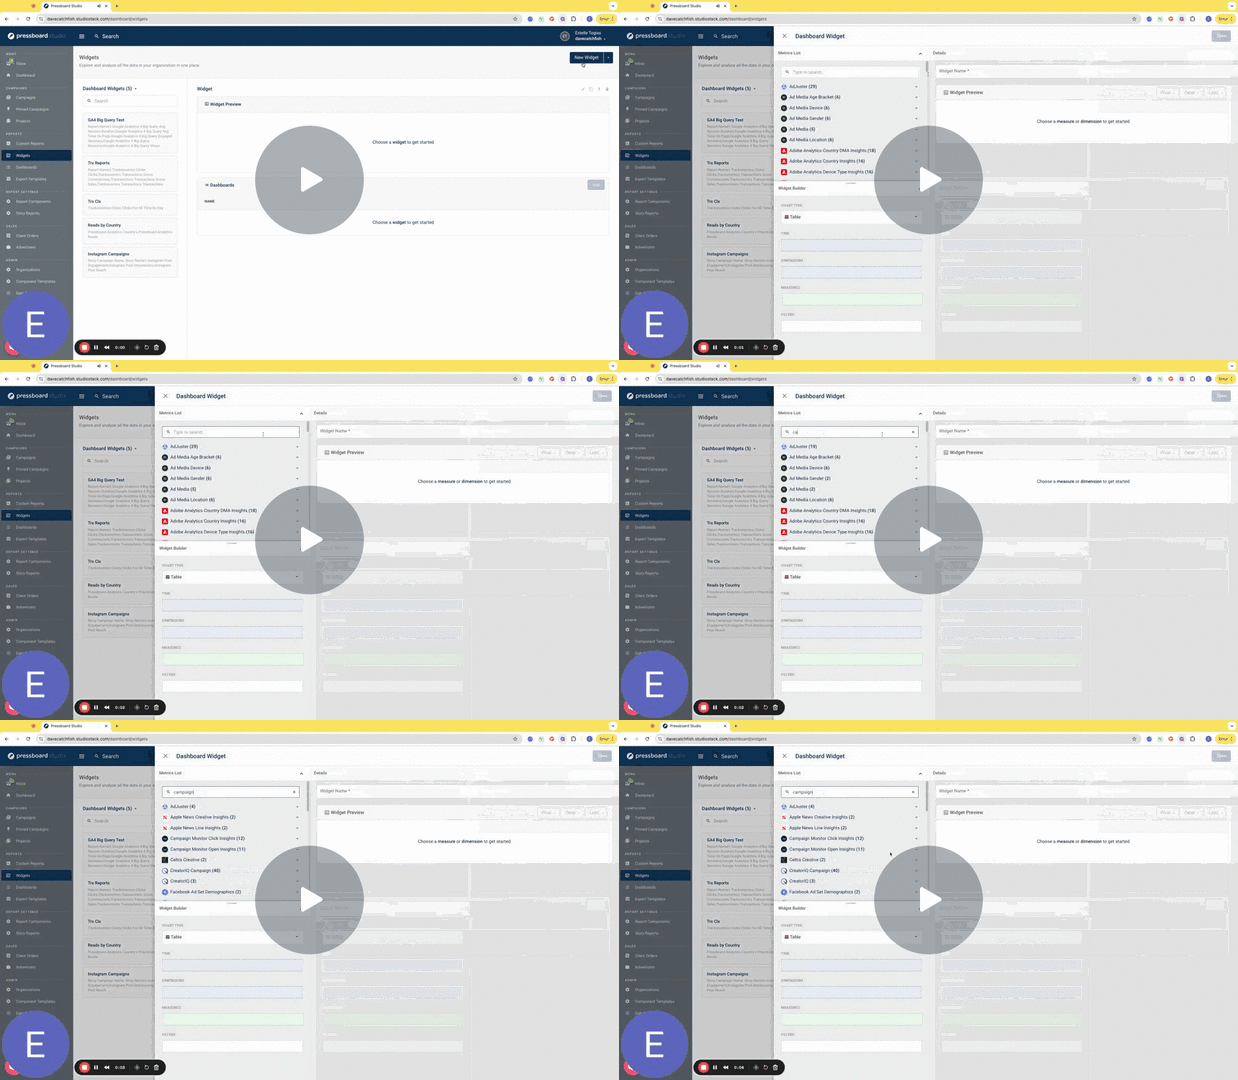
Widgets Demo no.1 - Watch Video

Widgets & Dashboards
These tools combined provide a way to generate benchmarks and gain fast access to business critical data. This in turn will help you present data-backed insights back to your stakeholders, inform planning and campaign optimisation.
The below scenarios outline how you can get the most value out of these modules:
- Explore your account data based on what you want to find out (or qualify) about your business, adding at least one measure and dimension. Start with an hypothesis i.e "we deliver the best time on page for advertisers in our healthcare vertical" or ask a question "what is the average time on page we deliver for content type X"
- Present digestible benchmarks that can add depth to your analysis using the Widgets builder and furthermore pin related widgets to a single view or Dashboard i.e "2024 benchmarks" or "Video content benchmarks". More on building Widgets here
Some recommendations to help you get started are summarised at the bottom of this article.
Labels for meaningful benchmarking
Labels enable you add context to your data based on your business logic. As a result you can drill down into the data to expose insights across your content. More on creating labels and examples to inspire you here
For example, apply labels for Verticals to your campaign Stories and to view metrics broken out along these lines or furthermore stack your labels in order to see how each Vertical performed within each of your Products. Examples here
Universal Date dimension
This is centalised filtering mechanism allowing you to specify a date range that applies to all reports within a query (Web Analytics, Display, Social etc). This is particularly useful for querying branded content activities within a specific reporting cycle. When applied as a filter, it will unify campaign data based on a single time frame.

Note, Universal Date applies to all reporting cubes that support date filtering. However, certain reports, like Instagram Posts and Facebook Posts, provide only lifetime data. As a result, the Universal Date mechanism is not compatible with queries involving these reports and their associated metrics.
To reference whether data sources support the ability to filter by date or apply a custom date range, follow steps outlined in this guide.
Create Dashboards and start pinning benchmarks
Group related widget queries together and pin them to a single Dashboard. You may wish to create multiple Dashboards for different business units if it make sense i.e Content, Sales, Paid Media etc.
'Star' your dashboard so that it appears in the main menu for easy reference as a bookmark


1) Labels - Vertical breakdown

Widget Builder (guide only)

- Select the Pivot chart type
- Apply filter for Label Name (dimension filter)
- Apply Label Value (dimension) to see applicable values related to the Label Name
2) Stacked Labels - Content Type x Vertical

Widget Builder (guide only)

- 1 x Label Name (dimension filter) equals or contains "Vertical"
- 1 x Label Name Filter (dimension filter) equals or contains "Content Type
- Select the Pivot chart type in order to see Label Values and Filter stacked
- Ensure Label Value and Label Value Filter are selected as dimensions to display results based on Label Name criteria
Recommendations:
- Start with building Labels first and systematically applying them to campaign Stories. You may want to think about what you want to measure like Vertical, Content, Client Tier etc. If you have a taxonomy in place already you can simply lift and shift!
- Keep it simple; build up from queries like ' the Average Active Time for Vertical X last year' to 'the Average Active Time for the same Vertical limited to only Video content'.
- Ask whether you already have a system in place for tracking results and benchmarking (perhaps an excel file that is being manually updated). If you need extra support designing the widgets in Pressboard, reach out to your customer success manager.